0I6K trade ideas
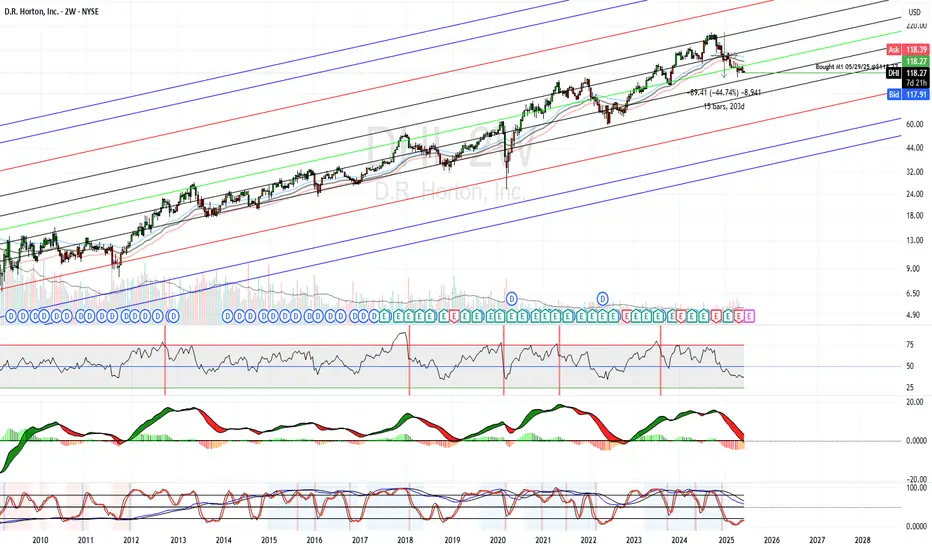
Can DH Horton Pull Up?Could DH use this Bull Cypher to pull out of the most recent correction? or do the fundamentals prevail?

DR Horton Stock Quote | Chart & Forecast SummaryKey Indicators On Trade Set Up In General
1. Push Set Up
2. Range Set up
3. Break & Retest Set Up
Notes On Session
# DR Horton Stock Quote
- Double Formation
* Start Of (Diagonal) At 30.00 USD | Completed Survey
* (Middle Range)) & Long Set Up Entry | Subdivision 1
- Triple Formation
* Wave Feature / Ongoing Wave (3)) On Uptrend Bias | Subdivision 2
* (TP1) | Subdivision 3
* Daily Time Frame | Trend Settings Condition
- (Hypothesis On Entry Bias)) | Logarithmic Settings
- Position On A 1.5RR
* Stop Loss At 92.00 USD
* Entry At 122.00 USD
* Take Profit At 166.00 USD
* (Uptrend Argument)) & Pattern Confirmation (Inverted Structure)
* Ongoing Entry & (Neutral Area))
Active Sessions On Relevant Range & Elemented Probabilities;
European-Session(Upwards) - East Coast-Session(Downwards) - Asian-Session(Ranging)
Conclusion | Trade Plan Execution & Risk Management On Demand;
Overall Consensus | Buy

$100 Target for DHINYSE:DHI
Given the already weak market, the housing market has been experiencing a decline in revenues for the past two quarters more specifically DR Horton and Lennar. This stock ahs been propped up for some time, however, I believe we will start to see major flushes before the 10 year yield starts to go down to anywhere between 3-3.5% with which I believe we will start to see a nice bounce in housing stocks.
I am in May 2 EXP. Puts long at an average of $1.15 and April 17 EXP. Puts long at $0.90. My preference is to take profit on the 16th for my April puts due to Earnings report on the 17th and take off half of my position on the May Puts as well. Leave the runners on up until week of expiry for the remaining May Puts.

$DHR Buying SupportD.R. Horton, Inc. is a housing company that builds and sells single-family homes. They're split into six main regions: Northwest (Colorado, Oregon, Utah, and Washington), Southwest (Arizona, California, Hawaii, Nevada, and New Mexico), South Central (Arkansas, Oklahoma, and Texas), Southeast (Alabama, Florida, Louisiana, and Mississippi), East (Georgia, North Carolina, South Carolina, and Tennessee), and North (Delaware, Illinois, Indiana, Iowa, Kentucky, Maryland, Minnesota, Nebraska, New Jersey, Ohio, Pennsylvania, Virginia, and West Virginia). The company was started by Donald Ray Horton back in 1978 and is based in Arlington, Texas.

2025 DHI Long Term BuyWatching a long-term buy opportunity on NYSE:DHI in 2025
The Jeanius Indicator give me the following buy signals:
Testing an uptrend line from the 3M timeframe
Took out liquidity at an untested low
Structural uptrend
The Jeanie also gives signals on the chart every time this combination happened in the past!

Entry point for DHI?I am certainly no expert and I would like others opinions on this one, as no ideas have been published on DHI for awhile.
Looking at the 1hr chart, it looks we are at a solid entry point on DHI. We are seeing a nice breakout from the trend over the last 30-days.
Based on the history this year, I would expect it to bounce from either the $158 low yesterday, or possibly fall a little more to $154 on Monday or Tuesday before reversing. There's solid support from Jan 18th and May 15th at $158. We have already seen this same pattern twice this year, and in those cases it dropped a little more before reversing. So, $154 seems reasonable. I am just waiting on confirmation before entering.
I suspect this will hit near or above $200 in the next two to three weeks, a 25% increase.

D.R. Horton Broke Out. Now it’s Pulled BackD.R. Horton broke out to new highs last month, and now it’s pulled back.
The first pattern on today’s chart is the July 25 weekly low of $170.33. The homebuilder probed below this level a few times last week but managed to remain above it. That may suggest that new support has been established above its previous record high from April 2.
Second, the 21-day exponential moving average (EMA) is rising from below to the same price area. The 8-day EMA is also above the 21-day EMA. Those signals may reflect a bullish short-term trend.
Third, the 50-day simple moving average (SMA) recently crossed above the 100-day SMA. Both are above the slower-moving 200-day SMA. Those signals may reflect a bullish longer-term trend.
Next, a stochastics crossover has occurred near oversold territory.
Finally, you have the series of lower highs since the end of July. Traders may now watch for a potential breakout through that falling trendline – especially with key housing data scheduled for later this week. (NAHB’s homebuilder sentiment index is on Thursday, followed by housing starts and building permits on Friday.)
TradeStation has, for decades, advanced the trading industry, providing access to stocks, options and futures. See our Overview for more.
Past performance, whether actual or indicated by historical tests of strategies, is no guarantee of future performance or success. There is a possibility that you may sustain a loss equal to or greater than your entire investment regardless of which asset class you trade (equities, options or futures); therefore, you should not invest or risk money that you cannot afford to lose. Online trading is not suitable for all investors. View the document titled Characteristics and Risks of Standardized Options at www.TradeStation.com . Before trading any asset class, customers must read the relevant risk disclosure statements on www.TradeStation.com . System access and trade placement and execution may be delayed or fail due to market volatility and volume, quote delays, system and software errors, Internet traffic, outages and other factors.
Securities and futures trading is offered to self-directed customers by TradeStation Securities, Inc., a broker-dealer registered with the Securities and Exchange Commission and a futures commission merchant licensed with the Commodity Futures Trading Commission). TradeStation Securities is a member of the Financial Industry Regulatory Authority, the National Futures Association, and a number of exchanges.
TradeStation Securities, Inc. and TradeStation Technologies, Inc. are each wholly owned subsidiaries of TradeStation Group, Inc., both operating, and providing products and services, under the TradeStation brand and trademark. When applying for, or purchasing, accounts, subscriptions, products and services, it is important that you know which company you will be dealing with. Visit www.TradeStation.com for further important information explaining what this means.

Finer Market Points: SP500 Top 10 Momentum Stocks: 25 Jul 2024NYSE:SW NYSE:DHI NYSE:CFG NYSE:MTB NASDAQ:INCY NYSE:TFC NYSE:UNH NASDAQ:HBAN NYSE:RF NYSE:PNC
Momentum leading shares are the market's best performers today. They are the fastest-growing shares in the SP500 over the last 90 days. These companies can't get to be leaders without first appearing on our Launch Pad list.
The Launch Pad List is calculated daily.
Today's SP500's Top 10 Quarterly Momentum Stocks are:
Smurfit WestRock plc Ordinary Shares (SW)
D.R. Horton, Inc. Common Stock (DHI)
Citizens Financial Group, Inc. Common Stock (CFG)
M&T Bank Corporation Common Stock (MTB)
Incyte Corporation - Common Stock (INCY)
Truist Financial Corporation Common Stock (TFC)
UnitedHealth Group Incorporated Common Stock (UNH)
Huntington Bancshares Incorporated - Common Stock (HBAN)
Regions Financial Corporation Common Stock (RF)
PNC Financial Services Group, Inc. (The) Common Stock (PNC)

DHI D.R. Horton Options Ahead of EarningsAnalyzing the options chain and the chart patterns of DHI D.R. Horton prior to the earnings report this week,
I would consider purchasing the 160usd strike price Calls with
an expiration date of 2024-11-15,
for a premium of approximately $14.25.
If these options prove to be profitable prior to the earnings release, I would sell at least half of them.

DHI, BX & CG - Charts Suggest a Possible Upward MovementD.R HORTON
After analysing the historical stock price, it is clear that the stock has been on an upward trend.
Following the market crash in March’20, the price began its upward movement.
During this uptrend, the price initially formed a Bullish Pennant pattern, leading to a surge after the breakout.
Around the 107 level, the stock faced resistance and started to decline.
However, the stock found support near the 60 level and started to climb again.
During this consolidation phase, an Inverted Head & Shoulder pattern emerged.
After the breakout of this pattern, the stock price consolidated above the breakout zone and recently experienced a new breakout.
It is anticipated that the trend will continue upwards and the price will reach new highs.
BLACKSTONE
After a powerful rally, the stock price experienced a notable correction.
It rebounded from the support around the 72 level.
Following an upward movement, the stock reached its trendline resistance area and faced rejection.
However, instead of dropping, the stock price began consolidating just under the resistance zone.
The stock recently achieved a new breakout.
With the RSI above 60, it suggests bullish sentiments in the market.
CARLYLE GROUP
The stock had been on a strong uptrend, hitting an all-time high at the 60 level.
However, it later plummeted by around 60% from that peak.
Following the drop, the price stabilized at a support level and consolidated for a while.
Now, the price seems poised for another breakout, potentially leading to a new rally.
With the RSI slightly above 60, it suggests bullish sentiments in the market.

$DHI Possible head and shoulder patternNYSE:DHI possible head and shoulder pattern forming. Watch $140 area for confirmation.
Invalidates if the price travel above $157.

Homebuilders are Heavily OverboughtOpened a credit spread on DHI yesterday, expect to hold this at least until the next FED meeting if not through earnings.
Sold - $150 Feb16 Call
Bought - $160 Feb16 Call
Taking in ~$400/contract in premium on this trade.

$DHI Supercycle Nearing CompletionThe stock is expected to complete its final move to Wave 5 of (V) before undergoing a significant correction, constituting a substantial correction in my view.
My extended target for the upward trend is $143, with plans to consider short positions thereafter. The recent upward movement appears to be forming a rising wedge, adding to the overall wedgy appearance.
The RSI shows a substantial bearish divergence since the completion of Wave III, signaling that Wave V is still underway. While the situation evolves, my current stance is to maintain a long position.

D.R. Horton Holds Triple DigitsHomebuilders like D.R. Horton were some of the top-performing stocks in the first half. Now, after a healthy pullback, traders may look for continuation into yearend.
The first pattern on today’s chart is the April 19 close of $101.86. DHI gapped higher the following session and kept climbing for the next three months. The stock then rolled over and fell through this month. It bounced in the same area on October 3 and retested on October 12. Has support been established at the old price level, which is also near triple digits?
Second, the nine-day Rate of Change (ROC) has recently turned positive. That may reflect an exhaustion of selling pressure.
Third, DHI is under its 200-day simple moving average (SMA) for the first time since November. Some long-term buyers may see value at such a spot.
Finally, the current price area represents roughly a 50 percent retracement of the stock’s move in the last 11 months.
TradeStation has, for decades, advanced the trading industry, providing access to stocks, options, futures and cryptocurrencies. See our Overview for more.
Important Information
TradeStation Securities, Inc., TradeStation Crypto, Inc., and TradeStation Technologies, Inc. are each wholly owned subsidiaries of TradeStation Group, Inc., all operating, and providing products and services, under the TradeStation brand and trademark. TradeStation Crypto, Inc. offers to self-directed investors and traders cryptocurrency brokerage services. It is neither licensed with the SEC or the CFTC nor is it a Member of NFA. When applying for, or purchasing, accounts, subscriptions, products, and services, it is important that you know which company you will be dealing with. Please click here for further important information explaining what this means.
This content is for informational and educational purposes only. This is not a recommendation regarding any investment or investment strategy. Any opinions expressed herein are those of the author and do not represent the views or opinions of TradeStation or any of its affiliates.
Investing involves risks. Past performance, whether actual or indicated by historical tests of strategies, is no guarantee of future performance or success. There is a possibility that you may sustain a loss equal to or greater than your entire investment regardless of which asset class you trade (equities, options, futures, or digital assets); therefore, you should not invest or risk money that you cannot afford to lose. Before trading any asset class, first read the relevant risk disclosure statements on the Important Documents page, found here: www.tradestation.com .

DHITagged the July low aka head & shoulders neckline perfectly & reversed today. Is it that easy? I've got the pink line below as the target if it plays out.

DHI approaching meaningful supportD.R Horton Inc. (DHI) presently approaching meaningful support, able to absorb weekly selling pressures. From here, (DHI) can recover and turn higher to channel resistance, eliciting gains of 20-25% over the following 3-5 months. Inversely, a weekly settlement below the shown support would place (DHI) into a sell signal where losses of a similar magnitude would be expected over the same time horizon.

DHI: Ascending Triangle, Confirmed (81.97%)(12/1000)(12/1000)
Ascending Triangle for DHI.
Confirmed. Possible 82% gains.
Pros:
1- Bullish Ascending triangle, Confirmed
2- Descending volume during formation
3- PPS above 50MA and 200MA
4- R/R ratio above 5
5- 250RSI above 50 and climbing
6- 50MA above 200MA
7- 50MA and 200MA ascending.
8- RS above 0 but a bit flat
9- ATR is ascending, more volatile
10- Golden cross circled in blue
Cons:
1- No additionnal volume at breakout
Target price is 197,64$.
Again, stay humble, have fun, make money!
MAAX!

D.R. Horton ($DHI) LongD.R. Horton, Inc. is a home construction company. Since 2002, the company has been the largest homebuilder by volume in the United States. Someone sold DHI 8/25 105P short and bought 120/130C spreads for 1.25... Same trader, multi-leg bullish strategy. Look for a bounce off the 50 day moving avg on this big cup and handle breakout... I would look into the DHI 8/25 120/130C spread for about 2.15. Target = 130 and payout could be 2-3.5x . HF recently flipped long on DHI according to Jefferies. Earnings later this month...

Top for homebuilders?I'm sure this is a fairly contrarian idea especially on the day the Fed will probably elect to not have a rate cut for the first time and over a year but isn't that how these markets work usually anyway ie natural gas plummeting after the pipeline from Russia to Europe was destroyed as everyone was piling in to anything natural gas related, so why not. Long-term shorting isn't really a trade for most people and this has implications to go all the way down in the 80 range over the next few years. Basically I'm calling the top and if I had a fundamental thesis behind any of this my first guess would be the supply of housing coming online with the largest population of any generation on its way out which is the baby boomers. Maybe some put options low risk if you can find some cheap out of the money leaps but derivative pricing has been ridiculous so make sure you understand the math

Developers May Start A Downtrend Or CorrectionOn Friday, all developers closed in red, some experienced a more significant drop than others. DHI and LEN have already fallen below the previous month's high, so they would be my best short candidates.
People are not going to be buying houses with mortgage rates through the roof. Multiple researches say the publish believes it is a bad time to buy a house.

DHI - Inverted H&San idea showing inverted H&S
could also be called a cup and handle if you disregard the prior left shoulder
Bullish above currently
Hourly chart

Bullish on D.R. Horton Inc. $DHI A Technical Analysis Trade D.R. Horton Inc. ( NYSE:DHI ) appears to be in a bullish trend with the potential to break past its resistance level at 110.52. The Williams Alligator indicator confirms this bullish sentiment with its "alligator mouth" open, indicating an uptrend. A potential trade idea could be to go long on NYSE:DHI if it breaks above 110.52, with a stop loss at 106.77 to manage risk.
Here are some reasons why this trade idea might be worth considering:
Strong Market Sector: The housing market sector has been performing well in recent months due to low interest rates and a shortage of inventory, which could provide support for $DHI.
Technical Analysis: The Williams Alligator indicator, along with other technical indicators, such as moving averages and MACD, suggest that NYSE:DHI is in a bullish trend.
Potential Upside: If NYSE:DHI does break past 110.52, there could be potential for further upside, potentially reaching its next resistance level at around 120.00.
Risk Management: The stop loss at 106.77 provides a level of protection for potential losses in case the trade does not go as planned.
Diversification: NYSE:DHI may provide diversification for a portfolio that already includes other types of stocks, such as technology or healthcare.
