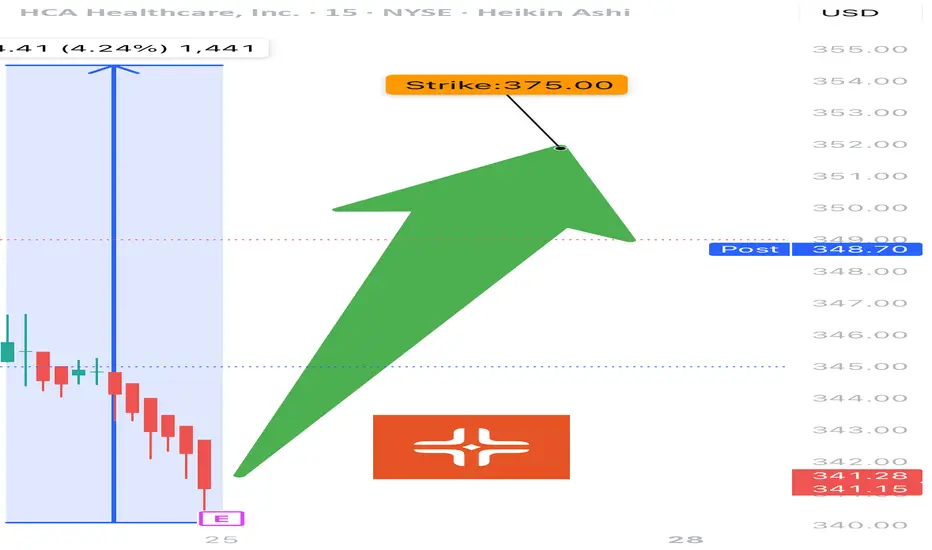
HCA EARNINGS TRADE (07/24)
🚨 HCA EARNINGS TRADE (07/24) 🚨
🏥 Healthcare with earnings tonight after close — high-upside setup brewing.
🧠 Quick Breakdown:
• 📊 Revenue Growth: +5.7% (stable, defensive sector)
• 💸 Margins: Operating 15.6%, EBITDA 19.9% = efficient and strong
• 🧠 Beat Rate: 75% with 6.7% avg surprise → credible upside
• 📉 RSI: 22.5 → OVERSOLD and primed for bounce
• 💬 Whisper sentiment strong from sector peers (e.g., Tenet)
• 🔥 Analysts target: $391.54 → 13.8% upside
💥 TRADE SETUP
🟢 Buy HCA $375 Call exp 8/15
💰 Entry: $3.90
🎯 Target: $11.70 (200–300%)
🛑 Stop: $1.95
📈 Confidence: 73%
⏰ Entry: Before Close Today (Pre-Earnings)
📆 Earnings: Today After Market (AMC)
📊 IV Rank: 0.60 → fair pricing
📉 Expected Move: ~5%
⚠️ RSI this low + sector strength = earnings bounce candidate. Watch the $375 breakout zone. 🎯
#HCA #EarningsPlay #OptionsTrading #HealthcareStocks #UnusualOptionsActivity #CallOptions #TradingView #DayTrading #OversoldBounce #EarningsSeason
0J1R trade ideas
HCA Healthcare | HCA | Long at $299.00NYSE:HCA Healthcare: P/E of 13x, earnings are forecast to grow 6.01% per year; earnings have grown 10.6% per year over the past 5 years, and trading at good value compared to peers and industry.
From a technical analysis perspective, it dipped to my selected historical simple moving average area and may represent a buying opportunity to fill the daily price gap up to $394.00. Thus, NYSE:HCA is in a personal buy zone at $299.00.
Target #1 = $324.00
Target #2 = $362.00
Target #3 = $394.00

HCA exhibits strong financial health!Technical Analysis
HCA's stock has demonstrated resilience, with a 52-week range between $276.50 and $417.14. The Relative Strength Index (RSI) stands at 58.01, suggesting the stock is neither overbought nor oversold. The Moving Average Convergence Divergence (MACD) is 0.11, indicating a potential upward momentum. However, some technical indicators present a neutral to bearish outlook in the short to mid-term. For instance, the stock's short-term trend appears neutral, while mid-term indicators lean bearish.
Fundamental Analysis
From a fundamental perspective, HCA exhibits strong financial health. The company maintains a Price-to-Earnings (P/E) ratio of 13.92, which is competitive within the Healthcare Facilities industry. Its Price-to-Sales (P/S) ratio is 1.16, closely aligning with the industry average of 1.11. The Price-to-Cash Flow multiple stands at 40.51, and the Price/Earnings to Growth (PEG) ratio is 1.51, indicating balanced growth relative to earnings.
CSIMARKET.COM
Recent earnings reports highlight HCA's robust performance. In the fourth quarter ending December 31, 2024, the company reported revenues of $18.285 billion, up from $17.303 billion in the same period the previous year. Same-facility admissions increased by 3.0%, reflecting strong demand for medical services. Despite challenges from Hurricanes Helene and Milton, which led to a 60-cent charge per share, adjusted earnings per share (EPS) were $6.22, surpassing the consensus estimate of $6.13.
Looking ahead, HCA projects its 2025 EPS to range between $24.05 and $25.85, with anticipated revenues between $72.8 billion and $75.8 billion. This optimistic outlook is driven by an aging U.S. population and increased demand for medical procedures, particularly among elderly Medicare members.
Analyst evaluations further underscore HCA's potential. A recent analysis rated the company at 91%, based on strong fundamentals and favorable valuation metrics.
Conclusion
Considering HCA's solid financial performance, positive earnings outlook, and favorable industry trends, the stock appears to have the potential to reach and possibly exceed the $390 mark. Investors should monitor market conditions and company-specific developments to make informed decisions.

HCA Advances as Tech StumblesHealthcare is the leading sector so far this year, and some traders may see opportunity in hospital operator HCA Healthcare.
Today’s weekly chart considers the all-time high above $410 in October, followed by a substantial pullback. Prices stabilized early this year around $290 (near the low from last April) before bouncing. The stock also based around an earlier peak from June 2023. Both of those points suggest new support has been established at old resistance.
Second, last week saw a bullish inside candle, which may suggest HCA has stabilized after the fourth quarter’s big slide.
Third, holding current levels or moving upward through Friday would produce the highest weekly close since November.
Finally, sector rotation may be an issue with investors mostly shunning large-cap growth in favor of non-cyclical safe havens. (Recent weeks also show outperformance in consumer staples and REITs, according to TradeStation Data.)
TradeStation has, for decades, advanced the trading industry, providing access to stocks, options and futures. If you're born to trade, we could be for you. See our Overview for more.
Past performance, whether actual or indicated by historical tests of strategies, is no guarantee of future performance or success. There is a possibility that you may sustain a loss equal to or greater than your entire investment regardless of which asset class you trade (equities, options or futures); therefore, you should not invest or risk money that you cannot afford to lose. Online trading is not suitable for all investors. View the document titled Characteristics and Risks of Standardized Options at www.TradeStation.com . Before trading any asset class, customers must read the relevant risk disclosure statements on www.TradeStation.com . System access and trade placement and execution may be delayed or fail due to market volatility and volume, quote delays, system and software errors, Internet traffic, outages and other factors.
Securities and futures trading is offered to self-directed customers by TradeStation Securities, Inc., a broker-dealer registered with the Securities and Exchange Commission and a futures commission merchant licensed with the Commodity Futures Trading Commission). TradeStation Securities is a member of the Financial Industry Regulatory Authority, the National Futures Association, and a number of exchanges.
TradeStation Securities, Inc. and TradeStation Technologies, Inc. are each wholly owned subsidiaries of TradeStation Group, Inc., both operating, and providing products and services, under the TradeStation brand and trademark. When applying for, or purchasing, accounts, subscriptions, products and services, it is important that you know which company you will be dealing with. Visit www.TradeStation.com for further important information explaining what this means.

Head & ShouldersThis pattern consists of 2 shoulders that should be in the same ballpark in price but are rarely the exact same price.
The 2 shoulders should be close to the same distance from the head which is a high point between the 2 shoulders.
T1 has just about been met. Sometimes t1 is all we get.
Earnings 10-24 BMO.
No recommendation
HCA Healthcare, Inc., through its subsidiaries, provides health care services in the United States. It operates general and acute care hospitals that offers medical and surgical services, including inpatient care, intensive care, cardiac care, diagnostic, and emergency services; and outpatient services, such as outpatient surgery, laboratory, radiology, respiratory therapy, cardiology, and physical therapy. The company also operates outpatient health care facilities consisting of freestanding ambulatory surgery centers, freestanding emergency care facilities, urgent care facilities, walk-in clinics, diagnostic and imaging centers, rehabilitation and physical therapy centers, radiation and oncology therapy centers, physician practices, and various other facilities. In addition, it operates psychiatric hospitals, which provide therapeutic programs comprising child, adolescent and adult psychiatric care, adolescent and adult alcohol, drug abuse treatment, and counseling services. The company was formerly known as HCA Holdings, Inc. HCA Healthcare, Inc. was founded in 1968 and is headquartered in Nashville, Tennessee.

HCA - head & ShouldersThis is usually a market leader! When market leaders trigger bearish patterns, you need to be cautious.
Not an all out short but with bearish consolidation under the neckline it's worth taking a stab.
As long as rejection occurs at the neckline this could see like downside.

$HCA with a bullish outlook following its earnings #StocksThe PEAD projected a bullish outlook for NYSE:HCA after a negative over reaction following its earnings release placing the stock in drift C with an expected accuracy of 55.56%.

HCA Entry, Volume, Target, StopEntry: with price above 294.02
Volume: with volume greater than 4.08M
Target: 313.20 area
Stop: Depending on your risk tolerance; Based on an entry of 294.03, 287.64 gets you 3/1 Reward to Risk Ratio.
This swing trade idea is not trade advice and is strictly based on my ideas and technical analysis. No due diligence or fundamental analysis was performed while evaluating this trade idea. Do not take this trade based on my idea, do not follow anyone blindly, do your own analysis and due diligence. I am not a professional trader.

Watchlist 2023-04-25 $SPY $SPOT $FRC $KEY $HCA $SQMAMEX:SPY - was stuck in the +/- 1 range around the high volume node at 412 until it made a sharp dive in the after hours trading. The drop could likely be due to the aftermath of FRC reporting a drop in deposits after the crisis by 100 Billion, which spread fear of contagion to other regions. If SPY rejects the 412 area early on and breaks 410 support, expect lower prices to follow for at least a portion of the day. SPY has been stuck in a tight range for a few weeks but perhaps a catalyst like this is enough to allow bears to regain control.
For further confirmation of a trend day, watch for:
USI:ADD pinned near +\-2000
USI:VOLD ratio over +/- 3
USI:TICK cumulating past 0 wicking to +/-900
NYSE:SPOT - Qtrly Revenue Grew 14%, Led By Subscriber Gains. Up 2.3 ATRS on 3 RVOL trading over the 1.37 pivot top. Rvol is enough to sustain a large cap ATRs move as so so I [m not necessarily expecting a pulback to the 137 support but wil be prepared if we get it if the SPY remains weak. Else, want to give this a few minutes off the open, if 137 firms, looking for buy set ups and will then need to see a break of 141 PM high.
NYSE:FRC - The troubled bank said lost half of its deposits at more than 100 Billion and Analysts reported deposit outflows were much worse than Wall Street estimates and at a "level that could prove very hard to come back from." FRC is in trouble under 12.60 pivot. Anyone who bought the second drop on march 20 AVVWAP is also very underwater. This could be a quick trade short off the open, but be cautions as this trade is so obvious that there is potential for a short squeeze.
NYSE:KEY - also looking like a good region bank short below 10.86 which is range support AND the yearly pivot support. Key reported losses on April 20 and has been cascading since.
Other watches:
NYSE:SQM - huge move PD as chile plans to nationalize lithium reserves. Bad news for SQM. Watching for weakness under 666 or strength over 67.50.
NYSE:HCA - day 3 continuation break over 289

$HCA with a Bullish outlook following its earnings #Stocks The PEAD projected a Bullish outlook for $HCA after a Negative over reaction following its earnings release placing the stock in drift C with an expected accuracy of 42.86%.

HCA - MegaphoneA megaphone structure
Price has touched the upper line, and is consolidating within this upper region
The strong double bottom that was seen in green oval allows price to form a support above the middle in this upper region.
I have shown potential price movement with a double curve.

$HCA with a Bullish outlook following its earnings #Stocks The PEAD projected a Bullish outlook for $HCA after a Negative over reaction following its earnings release placing the stock in drift C with an expected accuracy of 42.86%.

$HCA with a Bullish outlook following its earnings #Stocks The PEAD projected a Bullish outlook for $HCA after a Negative over reaction following its earnings release placing the stock in drift C with an expected accuracy of 42.86%.

HCAI am aware of this corp lol
Just randomly looked at chart
Not a distressed buy
But nice 50% retrace and geometry
Bull af imho
NOT TARDING ADVICE
GRI2022

$HCA with a Bullish outlook following its earnings #Stocks The PEAD projected a Bullish outlook for $HCA after a Positive over reaction following its earnings release placing the stock in drift B with an expected accuracy of 57.14%.

HCA oversold might be a buy here AGAINSame level of oversold last time I traded this in April. Markets oversold looking for a bear market rally in stocks overall.

HCA $HCA High-risk Initial LongHCA $HCA High-risk Initial Long. SL and TP on chart. Move SL on TP. At TP2, trail with offset 1.5ATR and 0.5 offset.
Backtest: 71% hit rate @ TP1 since 2011.

HCA Buy Along Trendline Using Fib Circles an area can be seen where all plotted circles coalesce upon one point
Since then price has recovered back to the main Trend line , which is intact

HCA - Is Healthcare Worth Considering Now? Given that we are coming out of pandemic now and the pressure on hospitals is going to reduce is it worth picking up hospital operator for a potential 30% upside?
Fundamental indicators:
Revenue and Profits - demonstrated consistent long-term earnings growth over the past 10 years. However, increasing wages are eating into the profits
Profit margin - low margin with 8.7% in 2021
P/E - very attractive 9.9x ratio compared to 22x for the whole market
Liabilities - historically liabilities are on the level with assets, and debt to shareholder equity is negative
Technical Analysis (Elliott Waves):
Since March 2020 crash HCA has enjoyed a good rally peaking in April 2022
The sharp drop from the historic high is indicating that there was an Expanded Flat correction formed with an impulse in wave C
Since then there was a zigzag like movement to the upside which indicates that an Ending Diagonal is potentially forming. However, at this stage it is difficult to predict how the waves are going to develop at this stage
If the proposed scenario is correct we can expect waves 3 and 5 also formed by zigzags and correction in wave 4 intruding into the territory of wave 1
Let's see how it develops further.
What do you think about this scenario for HCA Healthcare Inc ?
Please share your thoughts in the comments and like this idea if you agree wit it.
Also let me know if you would like to see other stocks analysed using Elliott Waves.
Thanks

HCA oversold and overdone dropLooking for an oversold bounce to $225 range. Long 1500 shares $211 average. Will add 250 shares every $2 drop as this could see $190 range. If stocks breaches $200 I will begin buying calls. As I'm not confident the bottom is in, I would prefer to be long common shares for now.

April pops & dropsApril pops & drops:
FB
TWTR
HPQ
VERU
AMZN
NFLX
HCA
EDRY
Do your own due diligence, your risk is 100% your responsibility. This is for educational and entertainment purposes only. You win some or you learn some. Consider being charitable with some of your profit to help humankind. Good luck and happy trading friends...
*3x lucky 7s of trading*
7pt Trading compass:
Price action, entry/exit
Volume average/direction
Trend, patterns, momentum
Newsworthy current events
Revenue
Earnings
Balance sheet
7 Common mistakes:
+5% portfolio trades, capital risk management
Beware of analyst's motives
Emotions & Opinions
FOMO : bad timing, the market is ruthless, be shrewd
Lack of planning & discipline
Forgetting restraint
Obdurate repetitive errors, no adaptation
7 Important tools:
Trading View app!, Brokerage UI
Accurate indicators & settings
Wide screen monitor/s
Trading log (pencil & graph paper)
Big, organized desk
Reading books, playing chess
Sorted watch-list
Checkout my indicators:
Fibonacci VIP - volume
Fibonacci MA7 - price
pi RSI - trend momentum
TTC - trend channel
AlertiT - notification
tickerTracker - MFI Oscillator
www.tradingview.com

$HCA with a Bearish outlook following its earnings #Stocks The PEAD projected a Bearish outlook for $HCA after a Negative Under reaction following its earnings release placing the stock in drift D with an expected accuracy of 100%.

HCA-BUY++The decline is to quick and too much, even though the financials were a shocker.
The drop was severe, and the RSI is low, not very extreme, but considering the drop, we should be looking at buy strategy.
Strategy BUY @ 200-220 and add @ 175-185 again. The correction will likely fill 75% of the dark candle. I suggest profit order $ 275-300 for now.
