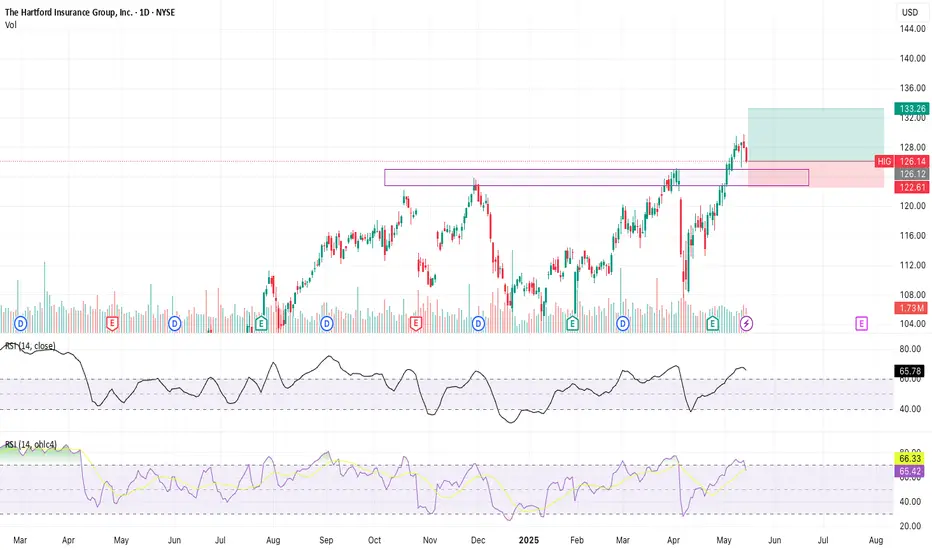
HIG LongFinancials look good
technical indicators show long signals
positional trade based on chart pattern
0J3H trade ideas
HIG - Circles Predicting MovementExpect similar movement as to that within the oval shape in green through the fib circle. The Fib Circle touches the lowest point on the chart which is the 08' crash in white circle
Drew the circles using the strongest trend lines on the chart that also align with significant events, that being the 08 crash on this chart
See how the circles play out on this Weekly timeframe

The Hartford. Head & Shoulders Strategy Takeaways the GlenThe Hartford Financial Services Group, Inc., usually known as The Hartford, is a United States-based investment and insurance company. The Hartford is a Fortune 500 company headquartered in its namesake city of Hartford, Connecticut.
It was ranked 160th in Fortune 500 in the year of 2020. The company's earnings are divided between property-and-casualty operations, group benefits and mutual funds.
The Hartford is the 13th-largest property and casualty insurance company in the United States. It sells products primarily through a network of agents and brokers, and has also been the auto and home insurance writer for AARP members for more than 25 years.
The main technical graph illustrates it's been a long 15-years path since The Hartford NYSE:HIG has 24x crashed within the 2007-09 financial crisis before it reached the bottom in 2009 around $ 3 per share, compared with $ 106 per share at the top of 2007.
Following to massive Head & Shoulders structure, mostly above 5yrs SMA, helped The Hartford to recover almost all losses since 2007 , while currently stocks prices are around $ 85 per share - at the highest level over the past 15 years since January, 2008.
In nowadays technical graph says The Hartford is about to break the rules, while strong H&S breakout is happening and can help stocks to achieve new highs in a short future.

HARTFORD Stock Chart Fibonacci Analysis 101423 Trading Idea
1) Find a FIBO slingshot
2) Check FIBO 61.80% level
3) Entry Point > 70/61.80%
Chart time frame : B
A) 15 min(1W-3M)
B) 1 hr(3M-6M)
C) 4 hr(6M-1year)
D) 1 day(1-3years)
Stock progress : A
A) Keep rising over 61.80% resistance
B) 61.80% resistance
C) Hit the bottom
D) Hit the top
Stocks rise as they rise from support and fall from resistance. Our goal is to find a low support point and enter. It can be referred to as buying at the pullback point. The pullback point can be found with a Fibonacci extension of 61.80%. This is a step to find entry level. 1) Find a triangle (Fibonacci Speed Fan Line) that connects the high (resistance) and low (support) points of the stock in progress, where it is continuously expressed as a Slingshot, 2) and create a Fibonacci extension level for the first rising wave from the start point of slingshot pattern.
When the current price goes over 61.80% level , that can be a good entry point, especially if the SMA 100 and 200 curves are gathered together at 61.80%, it is a very good entry point.
As a great help, tradingview provide these Fibonacci speed fan lines and extension levels with ease. So if you use the Fibonacci fan line, the extension level, and the SMA 100/200 curve well, you can find an entry point for the stock market. At least you have to enter at this low point to avoid trading failure, and if you are skilled at entering this low point, with fibonacci6180 technique, your reading skill to chart will be greatly improved.
If you want to do day trading, please set the time frame to 5 minutes or 15 minutes, and you will see many of the low point of rising stocks.
If want to prefer long term range trading, you can set the time frame to 1 hr or 1 day.

$HIG with a bullish outlook following its earnings #StocksThe PEAD projected a bullish outlook for $HIG after a Negative over reaction following its earnings release placing the stock in drift C with an expected accuracy of 71.43%.

$HIG with a Bullish outlook following its earnings #Stocks The PEAD projected a Bullish outlook for $HIG after a Negative over reaction following its earnings release placing the stock in drift C with an expected accuracy of 60%.

HIG - Right ShoulderInverted head and shoulders pattern on this 9H timeframe This is all within a larger uptrend, the right shoulder could also be considered a test of the bottom of the larger up channel

$HIG with a Neutral outlook following its earnings #Stocks The PEAD projected a Neutral outlook for $HIG after a Negative Under reaction following its earnings release placing the stock in drift D with an expected accuracy of 80%.

Long term hold for HIGHIG gearing up to new highs.
Potentially a good long term hold. Financial services do well in periods of high interest rates. Insurance companies invest premiums into fixed income securities to drive income, which is very important for their profitability. Expect the improvement in the interest rates to increase the yields. Premiums and fees income is likely to grow with the recovery in the economy.
TA points
● Multiple touches of the 200 day EMA prior to strong uptrend
Target
Fibonacci extension levels from this new top are:
F1 0.618: T1 80.4
F2 1.612: T2 88.6
F3 2.618: T3 96.9
F4 3.618: T4 105
● Golden ratio mutliper zone is 105

HIG Hartford Bearish divergence Weekly and DailyWeekly:
After an upwick tail, we now have a bearish divergence on MACD lines, MACD-Histogram as wel as EFI. There is even a ATR channel divergence. Stochastic RSI coming from an oversold condition and now bearish, moving in the reference area.
Daily;
A list of bearish divergences, supporting the idea on the higher TF. Currently, daily candle went up and closes lower, showing as well that the direction is going down. EFI close to the 0 level and possibly going through it. If this trend breaks we could see it moving down to the -2 ATR level, and possibly after a pull up, a next leg down, forming a lower low, which would be the second target.
Entry:
around 73,5 (on intraday TF, I entered at market open, when it ticked up)
SL, 76.2
Target 1: 70.02
Target 2: 66.7
Target 1 might be conservative, I'll see how it moves then, to see if I take 1/3 or 1/2 of the table.
R/R ratio: 1:2 & 1: 3.5

HIG looking to go higher?* Great earnings
* Strong up trend since 2009
* Broke out of a long consolidation period with slightly higher volume than average
Trade Idea:
* If you don't mind a little volatility you can enter now as indicated
* Given the volume and price action, this may visit the 70.80 area before heading up further.

HIG Breaks builds support and test ATH pivot - LONG - 3:1Run up to T1 looking probable now that HIG has broken out of minor pullback and sustained new support.
Closing over pivot will give us high probability to reach T1 and give us a free trade to ride to potential T2.

HIG - Buyers are asked to fasten their belts before takeoffWe expect climbing to begin when the moving averages reach the minimum point. On belay!


HIG: Bullish Flag (31%), Ascending triangle (71%)Primary Target:
Bullish Flag, unconfirmed (31%)
PT =90.93$
Secondary Target:
Ascending triangle, confirmed (71%)
PT =94.96$

HIG: Bullish Flag (31%)Bullish Flag (31%)
Pros:
Volume during post formation
Descending volume during Flag
Golden cross in blue
PPS above 50MA and 200MA
RS above 0 and ascending
R/R ratio above 9
ATR ascending
250RSI above 50 and ascending
200MA ascending
Target:
PT = 90.93$
Help how ever you can to keep this alive.
Thank you to those who have donated Coins!
Always do your own due dilligence. This is not financial advice
Stay Humble, have fun, make money!
Education:
www.dailyfx.com


HARTFORD FINANCIAL SERVICES GRP PLAN Hey traders, HARTFORD FINANCIAL SERVICES GRP is in a bullish dynamic fake with hammer candle and sell volume traded. In the TIMEFRAME M1 we see a hammer candle upside down with a purchase volume executed, it is heading towards its last previous low point. Who is below the low of the bollinger make a bearish swallow and start again in its rise. With the sound test lower with the base to reach the top of the stabilization zone for one more test. Great potential to break the price with a strong expectation of momentum at the same time for the zone to arrive in another zone.
And go to the next higher (View on MULTI TIMEFRAME H4) with an adjustment before and then an excess (on TIMEFRAME H1. After the same for the second highest breakout before the stabilization zone with test of the bullish channel top + symbolic figure of 55.00.
Please LIKE & FOLLOW, thank you!

HIG SWING LONGNYSE:HIG
broke above resistance, formed new candle above the symmetrical triangle
bullish volume last few days
2.1 buy rating, uptrend since October
this is not advice just my thoughts :)

$HIG follow the moneyHIG is looking good for a short term run, maybe longer, but Ill be out be end of the week. 10 EMA cross and strong momentum.s looking good for a short term run, maybe longer, but I'll be out be end of the week. 10 EMA cross and strong momentum. Today's gain was nice

