Hess Could Be Turning HigherEnergy is emerging as one of the stronger sectors this year, and some traders may see an opportunity in exploration-and-production company Hess.
The first pattern on today’s chart is the January 17 weekly close of $151.35. Prices have challenged this level but not yet closed above it. Could it now serve as a trigger for a breakout?
Second is the series of lower highs between last April and late November. HES began 2025 with a push above the falling trendline and it’s mostly stayed there since. That may indicate a period of downward movement has ended.
Next, the 50-day simple moving average (SMA) was below the 100-day SMA in November and both were under the 200-day SMA. The order flipped in subsequent months, with the faster SMAs now above the slower ones. The new alignment could reflect longer-run bullishness.
Finally, the lower study includes our 2 MA Ratio custom script. It shows the 8-day exponential moving average (EMA) pushing above the 21-day EMA, which is potentially consistent with short-term bullishness.
TradeStation has, for decades, advanced the trading industry, providing access to stocks, options and futures. See our Overview for more.
Past performance, whether actual or indicated by historical tests of strategies, is no guarantee of future performance or success. There is a possibility that you may sustain a loss equal to or greater than your entire investment regardless of which asset class you trade (equities, options or futures); therefore, you should not invest or risk money that you cannot afford to lose. Online trading is not suitable for all investors. View the document titled Characteristics and Risks of Standardized Options at www.TradeStation.com . Before trading any asset class, customers must read the relevant risk disclosure statements on www.TradeStation.com . System access and trade placement and execution may be delayed or fail due to market volatility and volume, quote delays, system and software errors, Internet traffic, outages and other factors.
Securities and futures trading is offered to self-directed customers by TradeStation Securities, Inc., a broker-dealer registered with the Securities and Exchange Commission and a futures commission merchant licensed with the Commodity Futures Trading Commission). TradeStation Securities is a member of the Financial Industry Regulatory Authority, the National Futures Association, and a number of exchanges.
TradeStation Securities, Inc. and TradeStation Technologies, Inc. are each wholly owned subsidiaries of TradeStation Group, Inc., both operating, and providing products and services, under the TradeStation brand and trademark. When applying for, or purchasing, accounts, subscriptions, products and services, it is important that you know which company you will be dealing with. Visit www.TradeStation.com for further important information explaining what this means.
0J50 trade ideas

HES Long Term Short to start TRUMP presidencyIMO the uptrend that HES has been on since Biden was in office and gas prices skyrocketed has been exhausted and come to an end. I believe the overall downtrend starts with the potential lowering of gas prices due to Trump energy policies. The technical indicators noted on the chart strengthen my opinion. If you have a different view or opinion, please let me know.
So Lets start.
The uptrend started in the beginning of November 2020. Notice 3 shaded boxes on left.
Chart pattern has double bottom
RSI is oversold, bounces up, comes back but stays above 30
MACD line breaks above the zero line
Notice the uptrend is sustained as price finds support when RSI would go into the 40-50 range
(long yellow shaded rectangular box)
The chart has a double top at the 161 area where RSI goes overbought comes back then holds below 70 signifying possible reversal. RSI keeps going down through the 40 RSI support level that held for 4 years. In that same time RSI goes below 40 MACD breaks below zero line.
After the price bounces back, notice it finds resistance and a double top at the 151.6 area and the RSI holds between 50-60 (red shaded box) levels signifying resistance for a continued downtrend.
NOTE HES has earnings on 1/29 which they have crushed this year. I dont see Dec being any different. I feel we get a pop where I will find an area to go short. SL will be above 162. I will have another entry below the blue trend line and or if it closes below 200 MA

HES | SHORTNYSE:HES
Technical Analysis of Hess Corporation (HES)
Key Observations:
Current Price Action:
Price: $137.31
Recent Drop: -12.94 (-8.61%)
Support and Resistance Levels:
Immediate Support: $135.95 (Bearish Line)
Further Supports: $129.00 (Target Price 1), $113.82 (Target Price 2), and $100.86 (Target Price 3)
Resistance: The price recently broke below a support level at around $150.76.
Trendlines:
The price has broken below a key upward trendline, indicating a potential shift from a bullish to a bearish trend.
Relative Strength Index (RSI):
Current RSI: 43.39
The RSI shows a decline, indicating increasing selling pressure and approaching the oversold zone.
Target Prices:
Target Price 1: $129.00
This level is the immediate support and a potential first target for any continued downward movement.
Target Price 2: $113.82
If the price breaks below the immediate support, the next target is around $113.82, a previous support level.
Target Price 3: $100.86
Further downside could see the price reaching $100.86, another key support level.
Summary:
Hess Corporation (HES) has experienced a significant drop, breaking below a key support level and its upward trendline. The next levels to watch are $135.95, $129.00, $113.82, and $100.86. The RSI indicates potential for further declines if market conditions remain negative.

HES CVX M&A ArbitrageCVX & HES are expected to complete a merger on 6/30/25. CVX will pay every holder of HES stock 1.025 shares of CVX per share of HES. This is represented by the spread. Spread has been widening since announcement date, and would be interesting to make a play on. FTC seems to be interested in having a say in the merger.
NYSE:CVX *1.025-NYSE:HES

Stocks pairs trading: APA vs HESExploring the financial indicators and market behaviors of APA Corporation (APA) and Hess Corporation (HES) offers crucial insights for investors looking to make informed decisions in their portfolios. This comparison sheds light on the value and potential risks associated with these energy sector stocks, guiding strategic investment choices.
Reasons to Consider Buying APA Over HES:
Valuation: APA's P/E ratio of 3.24 is significantly lower than HES's P/E ratio of 33.19, indicating that APA is potentially undervalued compared to HES. This suggests that APA could offer a more attractive investment opportunity based on earnings.
Forward P/E: APA's forward P/E of 5.74 presents a more appealing valuation compared to HES's forward P/E of 14.77, suggesting that APA's earnings are expected to grow at a better rate relative to its current valuation.
Dividend Yield: APA's estimated dividend yield of approximately 3.39% is higher than HES's yield of around 1.15% to 1.17%, making APA a more attractive option for income-seeking investors.
Market Performance: Despite APA's recent performance challenges, its significantly lower valuation metrics suggest that it might have less downside risk compared to HES, which has shown a substantial increase in its stock price over the past year.
Decision:
Buy 5 APA: Given its lower P/E ratio, attractive forward P/E, higher dividend yield, and potential for revaluation upwards, APA stands out as a solid investment for those seeking value and income.
Sell 1 HES: Considering HES's high valuation and the potential for market correction, reallocating investments from HES to more undervalued opportunities like APA could provide better long-term growth prospects and risk management.

Best Days of HES are OverLarge Motive Wave beginning after a large A-B-C Corrective Wave.
A wave of the large Corrective Wave was a leading diagonal, B a Zig-Zag and C an ending diagonal.
Resistance at 160 (observe peak of Jan 2023).

HES is an energy play on uptrendIt almost crossed above the supply zone from 160.52-151.13.
All moving averages are above the 200ma with 9ema above 21ema showing good uptrend.
Targets: 173.22 & 189.12 (Could reduce 50% size at 173.22)
Stop loss: close below 151.13

Reasons to buy Hess
It broke above major daily SMA cluster
It broke above all major weekly and monthly SMAs
It bounced off major trend channel
Bbands bandwidth at 5 year low

W Pattern HES - W Pattern - Consolidated most of March in form of a FLAG. I can see it hitting 120 once it breaks out.
The 24 analysts offering 12-month price forecasts for Hess Corp have a median target of 118.00, with a high estimate of 180.00 and a low estimate of 88.00. The median estimate represents a +23.64% increase from the last price of 95.44.

Cup and Handle in $HES. Look for pullback to $149.90Cup and Handle pattern and volume is higher. I would wait for a pullback to $149.90
NYSE:HES

$HES with a Bullish outlook following its earnings #Stocks The PEAD projected a Bullish outlook for $HES after a Positive Under reaction following its earnings release placing the stock in drift A with an expected accuracy of 100%.

Can Anything Stop Hess?Energy remains the top-performing sector this year. Today we’re focusing a member of the group with potentially classic breakout behavior: Hess.
The first pattern on the oil and gas stock’s chart is the is the October 26 surge above $137. That was the previous all-time high from 2008. A move through that level suggests old resistance has lost its relevance.
Second, it just completed a bullish inside week. That tight price action after the jump may help confirm the breakout.
Third, consider the 4-1/2 month consolidation period between mid-June and late-October. New highs following that pause could potentially draw buyers from the sidelines.
Finally, why did HES jump above $137? The answer was better-than-expected earnings and revenue amid strong production. Another potential catalyst is the company’s 30 percent stake in Guyana’s Stabroek Block offshore field, which also had more discoveries late last month.
TradeStation has, for decades, advanced the trading industry, providing access to stocks, options, futures and cryptocurrencies. See our Overview for more.
Important Information
TradeStation Securities, Inc., TradeStation Crypto, Inc., and TradeStation Technologies, Inc. are each wholly owned subsidiaries of TradeStation Group, Inc., all operating, and providing products and services, under the TradeStation brand and trademark. You Can Trade, Inc. is also a wholly owned subsidiary of TradeStation Group, Inc., operating under its own brand and trademarks. TradeStation Crypto, Inc. offers to self-directed investors and traders cryptocurrency brokerage services. It is neither licensed with the SEC or the CFTC nor is it a Member of NFA. When applying for, or purchasing, accounts, subscriptions, products, and services, it is important that you know which company you will be dealing with. Please click here for further important information explaining what this means.
This content is for informational and educational purposes only. This is not a recommendation regarding any investment or investment strategy. Any opinions expressed herein are those of the author and do not represent the views or opinions of TradeStation or any of its affiliates.
Investing involves risks. Past performance, whether actual or indicated by historical tests of strategies, is no guarantee of future performance or success. There is a possibility that you may sustain a loss equal to or greater than your entire investment regardless of which asset class you trade (equities, options, futures, or digital assets); therefore, you should not invest or risk money that you cannot afford to lose. Before trading any asset class, first read the relevant risk disclosure statements on the Important Documents page, found here: www.tradestation.com .

Earnings hit or miss. 1. Looks like it's not making a new high at this point.
2. Will need to reach a lower price to attract more buyers to increase the price
3. Trend has broken down.
@Mide408

HES weekly bearish hammer at all time highHES weekly bearish hammer at all time high had to take this one.

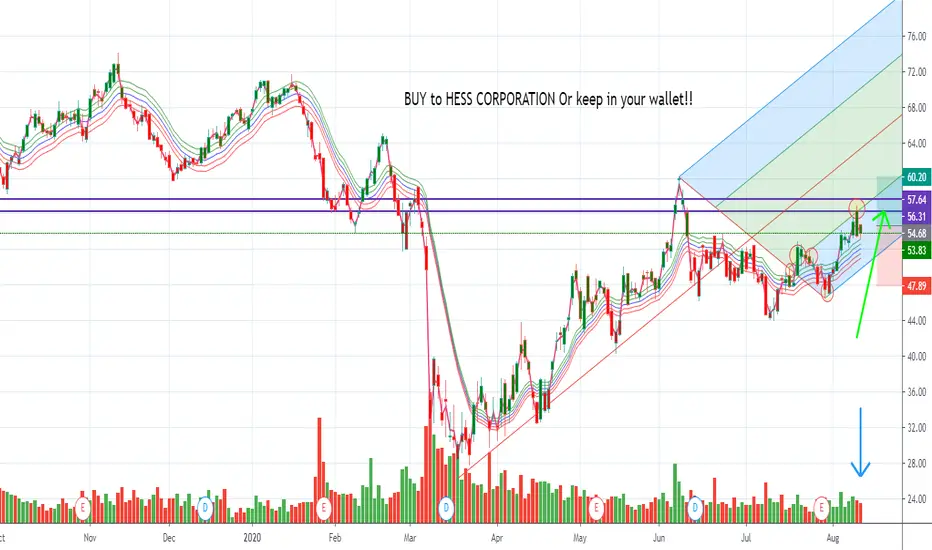
HES - Breakout Trend LineBreakout on dominant trend line
Can be seen to move out of resistance in red

HES USA Sun Storm Investment Trading Desk & NexGen Wealth Management Service Present's: SSITD & NexGen Portfolio of the Week Series
Focus: Worldwide
By Sun Storm Investment Research & NexGen Wealth Management Service
A Profit & Solutions Strategy & Research
Trading | Investment | Stocks | ETF | Mutual Funds | Crypto | Bonds | Options | Dividend | Futures |
USA | Canada | UK | Germany | France | Italy | Rest of Europe | Mexico | India
Disclaimer: Sun Storm Investment and NexGen are not registered financial advisors, so please do your own research before trading & investing anything. This is information is for only research purposes not for actual trading & investing decision.
#debadipb #profitsolutions
Cup and Handle Earnings 10-27 BMO Golden CrossPossible stop under handle low or mid cup which is 76.50
Cup low is 61.93.
Depth is 29.16.
No recommendation.
The 50 SMA has crossed up through the 200 SMA. The moving averages are still not in order and price is quite a ways above the 50 SMA.
Bull Flag and price appears to be breaking upper trendline of flag. Uptrend and a close above the flag needed to be valid as a bull flag can break to the downside as well.

HESDouble top pattern on this instrument
Now it is retesting the resistance level
Possible enter after breaking the first support level

Bullish Bat Bottom FishingGonna be R overhead
Possible T2 79.7 to 91
Possible stop below 36.6 after long entry level met
Not a recommendation

awaiting for Bullish BatShould take about 6 weeks, for this stock to hit the .886. Put it on the alert.

HESS Falling wedgeDepends on how it opens Monday watch out this falling wedge if it’s red day support at those red horizontal lines .

HESS CORPORATION Estimates DailyHey my friends, HESS CORPORATION is in a bullish contination on MULTI TIMEFRAME buyers rejection on a small sales volume but in the before session ditto. Strong possibility of going up on the last precedent higher with a buying force, we can find ourselves on the next high which corresponds to the upward gap on the high point Via TIMEFRAME 4 H only if the buyers are in the meeting.
Please LIKE & FOLLOW, thank you!
$HES Hess corporation gap fill opportunity trade the gap
Gap in price resistance
Dependent on OPEC outcome
