Making money in a downtrend - J is WILDI chose J as my public idea for the day for a lot of reasons
-it’s my best idea of the day (it’s #11 on my composite score list)
-covering a span of over 1800 trades (real and backtested), it has an AVERAGE gain of 2.9%.
-the 1 “losing” trade in all 1800+ was a signal from yesterday which I will boldly predict will become profitable too.
-it has a per day held average gain of over 3x that of the S&P500 over those 1800+ trades
-it’s right at support and has some more support further down both from previous highs and an unbroken uptrend line going back over 18 months
-it has a track record of rebounding nicely after earnings “disappointments”
-it’s trading in the middle of its 6 month range
But I also chose it to illustrate a point about the way I trade, and it’s one that is very relevant and about to become more relevant, I think. When the market starts to show weakness, people get scared of trading long. And I get that - it’s a valid concern. It’s easier to make money in an uptrend - that’s why so many people who have traded NVDA over the last 2 years think they are amazing traders. Rising tides lift ALL boats, even leaky ones. But making money in ANY environment is the difference maker.
J is down a little over 11% in the last 3 months or so. It is in the middle of a legitimate Wall Street definition of a correction. I am not picking the bottom here, or even trying to. That’s the point. I don’t care if this is the bottom. It’d be great if it was, but it doesn’t matter. Now I’m not saying my algo is the greatest thing ever (though it might be for me), but the WAY I use it is significant and it illustrates something ANYONE can do when a stock or markets are trending lower.
During this correction, my algo has signaled 14 LONG trades, including today. 12 have been closed profitably and one was the long signal yesterday (#14 was today). Full disclosure: I didn’t actually trade that signal yesterday, but I am today. The average gain on the 13 prior to today (including yesterday's "loser"), DURING A CORRECTION, is +0.9%.
Not only does it win, but it wins consistently even when stocks are trading lower. The key is as much how/when I exit as it is the algo and its entry signals. As soon as a lot is end of day profitable, it is gone. I don’t care how much I’ve made, it’s gone. And that is a secret to making money long during a downtrend. It helps a lot that my entry signals are good ones, but the key is GET OUT WITH A PROFIT.
Don’t let the market take its money back. It’s the same thing casinos try to do when you win and they have the edge - keep you playing so they can get their money back. I trade the same way in uptrends too. That leaves some money on the table then, but I take it back on the way down when I’m making money instead of losing it - and you can too. The method I use works in almost every situation, on almost any stock. But its shining moment is when things are going downhill. Not just because it makes money, but because I don’t worry about timing and downtrends much any more.
Some slides can get annoying under the right circumstances, but I don’t worry. This technique has worked in every major market downtrend in the last 50 years. Except for stocks that go to zero, it works on stocks in corrections or bear markets, though at a certain point even it will lose money (I’ll be posting an idea involving NVDA in that regard sometime relatively soon).
But relatively small losses are easily regained, especially if the win rate is high (which it obviously is here). The key is avoiding the BIG losses and this technique does that very well.
So I went long at the close at 132.19. Per my usual strategy, I'll add to my position at the close on any day it still rates as a “buy” and I will use FPC (first profitable close) to exit any lot on the day it closes at any profit.
As always - this is intended as "edutainment" and my perspective on what I am or would be doing, not a recommendation for you to buy or sell. Act accordingly and invest at your own risk. DYOR and only make investments that make good financial sense for you in your current situation.
0JOI trade ideas

JJacobs Solutions Inc. is an American international technical professional services firm. The company provides engineering, technical, professional and construction services.

$J with a Bullish outlook following its earnings #Stocks The PEAD projected a Bullish outlook for $J after a Positive over reaction following its earnings release placing the stock in drift B with an expected accuracy of 60%.

$J with a Neutral outlook following its earnings #Stocks The PEAD projected a Neutral outlook for $J after a Negative Under reaction following its earnings release placing the stock in drift D with an expected accuracy of 100%.

$J with a Bullish outlook following its earnings #Stocks The PEAD projected a Bullish outlook for $J after a Positive Under reaction following its earnings release placing the stock in drift A with an expected accuracy of 75%.

J presenting a BUY OPPORTUNITYNYSE:J
Enthusiastically Brought to You by ManhattanStocks
All Requests , Suggestions and Remarks are Welcome .

Cup and Handle/ Crab PatternEarnings 5=3 Before market opens. History of recent misses. Last quarter J missed on revenue and EPS. Price always recovers afterwards. Last earnings J fell to 114.11.
Sell side of cup has a high of 149.55 and was an ATH before drop at earnings. Cup depth is 35.44. There is usually resistance from the sell/1st/side of cup as it is a prior high. In this case it was an ATH.
Bullish candle at bottom of cup and a Bullish Crab pattern noted. Price did not quite hit the 1.618. I come from a family of engineers and my brothers work here so I have held this stock for a long time. Price always recovers but earnings have been an issue.
The Crab bounces at D due to price exhaustion as it reaches a low in the bullish Crab or a high in the bearish version. There is also a Deep Crab pattern. The CD leg is the longest of the 4 legs and should reverse close to the 161.8 percent of the XA leg and an extreme crab between the 224.0 to 361.8 percent extension of the BC leg. I do not see this pattern often in a bull market as it is a deep price reversal pattern. Similar to the butterfly pattern since D is below A in the bullish versions and opposite for bearish versions. The butterfly pulls close to the .786 at leg 2 and the crab can pull to the .382 to the .618 which differentiates the two patterns. The butterfly should reverse close to the 1.272. Peak 1 is higher than peak 2 in both of these patterns and D is below X in both patterns..
The retracement of the impulse wave is where I can start to figure which harmonic pattern it may be. Then the 3rd leg can become crucial as if it goes higher than peak 1 (or lower than valley 1 in the bearish versions), then I start looking for a shark or a cypher pattern. The landing pad for most harmonic pattern is close to an area of confluence.
No recommendation.
EPS (FWD)
7.11
PE (FWD)
20.72
Div Rate (TTM)
$0.86
Yield (TTM)
0.58%
Short Interest
1.32%
Market Cap
$18.62B
Jacobs Engineering Group Inc. provides consulting, technical, scientific, and project delivery services for the government and private sectors in the United States, Europe, Canada, India, rest of Asia, Australia, New Zealand, South America, Mexico, the Middle East, and Africa. The company operates in two segments, Critical Mission Solutions and People & Places Solutions. The Critical Mission Solutions segment provides cybersecurity, data analytics, systems and software application integration and consulting, enterprise and mission IT, engineering and design, nuclear, enterprise level operations and maintenance, and other technical consulting solutions. The People & Places Solutions segment offers data analytics, artificial intelligence and automation, software development, digitally driven consulting, planning and architecture, program management, and other technical consulting solutions. The company is also involved in the management and execution of wind-tunnel design-build projects; and design-build for water and construction management. Jacobs Engineering Group Inc. was founded in 1947 and is headquartered in Dallas, Texas.

Jacob's Engineering - Solid addition to your portfolioQuick TA on Jacob's Engineering - (J). This is a solid Pandemic Recovery investment, and actually just a good investment all around. This company does very well when the government is looking to spend on infrastructure repairs. Historically the dips on this stock have been short lived and seen as great buying opportunities. It has respected historical trend channels and support. Just recently it broke through a historical resistance point, creating upwards momentum. Any near future correction will respect this lines as support now.

Cup and HandleHas broken up from a C&H pattern..
Support below handle low and Mid Cup. Cup depth is 44.56. Targets calculated using fib levels and cup depth..
Not a recommendation
No rising wedges in yearly chart..NV is high..OBV is high..
The Negative Volume Index (NVI) is a cumulative indicator, developed by Paul Dysart in the 1930s, that uses the change in volume to decide when the smart money is active. The NVI assumes that smart money will produce moves in price that require less volume than the rest of the investment crowd.
NVI rises on days of positive price change on lower volume, NVI falls on days of negative price change on lower volume, and NVI is unchanged on days of higher volume no matter what the price action.
On-balance volume (OBV) is a technical trading momentum indicator that uses volume flow to predict changes in stock price. OBV shows crowd sentiment that can predict a bullish or bearish outcome..
Jacobs Engineering Group Inc. provides consulting, technical, scientific, and project delivery services for the government and private sectors in the United States, Europe, Canada, India, rest of Asia, Australia, New Zealand, South America, Mexico, the Middle East, and Africa. The company operates in two segments, Critical Mission Solutions and People & Places Solutions. The Critical Mission Solutions segment provides cybersecurity, data analytics, systems and software application integration and consulting, enterprise and mission IT, engineering and design, nuclear, enterprise level operations and maintenance, and other technical consulting solutions. The People & Places Solutions segment offers data analytics, artificial intelligence and automation, software development, digitally driven consulting, planning and architecture, program management, and other technical consulting solutions. The company is also involved in the management and execution of wind-tunnel design-build projects; and design-build for water and construction management. Jacobs Engineering Group Inc. was founded in 1947 and is headquartered in Dallas, Texas.

JACOBS ENGINEERING - 1M TF - Trendline ObservationTrendline Observation(s). A simple trendline breakout above 104 on Monthly Chart of JACOBS ENGINEERING after almost 13 Years. It was rejected once before in Feb 2020 from 104. Finally broke out last month. I did not find the volume overwhelming/high enough considering it is a previously tested ATH breakout. Volume above 20 million would've been great. Let's see how it works out in coming months. I'm learning chart patterns as of now. You can plan your trades accordingly if you know how to trade these patterns.


ABC BullishCup and Handle patterns are only valid over long entry level
NV is high
No rising wedges noted
Short interest mediocre but up 29% today.
Go with your gut.
My brother works for this company so I do admit I am partial.
Not a recommendation
Jacobs Engineering Group Inc. provides consulting, technical, scientific, and project delivery services for the government and private sectors in the United States, Canada, Europe, Asia, India, Australia, New Zealand, South America, Mexico, the Middle East, and Africa. The company operates through Critical Mission Solutions, and People & Places Solutions segments. The Critical Mission Solutions segment provides cybersecurity, data analytics, software application development, enterprise and mission IT, systems integration, and other technical consulting solutions to government agencies, as well as various aerospace, automotive, and telecom customers. The People & Places Solutions segment offers data analytics, artificial intelligence and automation, and software development solutions, as well as digitally-driven consulting, planning, architecture, and program management solutions. The company also offers engineering, design, and architectural services; construction services for wind-tunnel and water design-build projects; construction management services; and operations and maintenance services. Jacobs Engineering Group Inc. was founded in 1947 and is headquartered in Dallas, Texas.
Hide

J looking for the break of long term channel and wedgeJ was in a long term channel between 2015 and 2019.
In August 2019 it broke this channel for a move higher, retested in December 19 and was again moving to new highs, until Feb/March 2020 market crash.
It dropped and bounced at off the support of the long term channel, and has been forming a wedge at the top of the channel since.
I will be looking for it to break to top of the channel and continue its previous move up with targets at $104 and above.
I am anticipating a $5 to $10 pop if it breaks due to the current market environment.
Forward notes: Watch for a retest of the channel top in the coming weeks/months as it is likely to continue moving higher using the top of the channel as support.

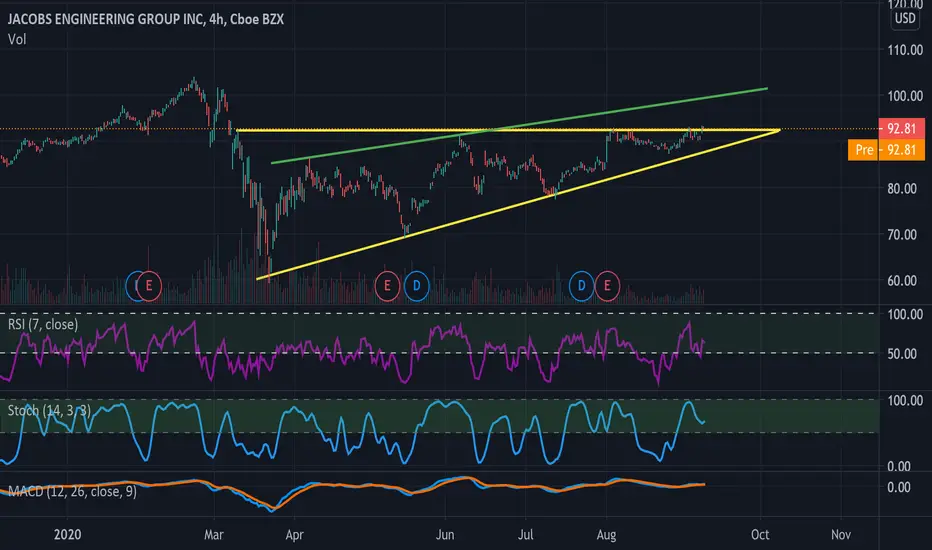
J - 7.44% Potential Profit - Ascending TriangleThis week we need to play conservative and take home whatever we can. Targets are moderate and realistic, and I aim to close positions fast, often before the end of the day.
Allocate less than usual capital if you would like an extra layer of safety. The market is uncertain and we want to keep our risk to the minimum.
Ascending Triangle broken out after a 3-month correction and ATH since COVID's crash. There is a lack of confirmation of the new support, which is a concern. Not ideal, however, I will venture regardless, as I'm chasing price right out of the gate and I'm keeping Stop Loss tight as a reflection of the risk
- Historical Uptrend
- RSI + Stoch above 50
- MACD above Signal
Suggested Entry $92.85
Suggested Stop Loss $91.83
Target price $99.21
About me
- August P/L: +203.83% | Wins 85.19% | No Trades without Analysis
- Note that I tend to adjust stop losses in order to secure profits early and preserve capital. This means that the target price is going to be achieved as long as there are no strong pullbacks that trigger my new adjusted stop loss.
JACOBS ENGINEERING GROUP View Hey guys, JACOBS ENGINEERING GROUP is in a fake bearish configuration with more buying volume than selling and there is an attempt by pent-up buyers. In the TIMEFRAME 5, above all a 1 Min, we have repression of sellers. But it is to confirm a low point to return to the decent conceded. It is plausible to arrive at the top of the consolidation zone, or even breakout the zone if the buyers are really making their returns.
Please LIKE & FOLLOW, thank you!

Cup and Handle ABC BullishPossible stop under 82.5
NV is high.
Not a recommendation
Buy red, sell green. I am trying to remember that! (o:

J: Ascending TriangleAscending Triangle
Pros
R/R ratio above 13
Descending volume
PPS above 50MA
250RSI above 50
Cons
PPS below 200MA
200MA Flat/Descending
ATR descending
If confirmed
PT1 = 89,66
PT2 = 92,95
PT3 = 95,46
PT4 = 98,31
PT5 = 103,80
PT6 = 111,75

Some long term outlook on Aveng.Let'swatch lower time frames for possible entries!
However this plays out it is the lowest risk to reward ever in the JSE....Be Mindful of the fundimentals aswell

J testing resistance#6 trade of the month - probably the last trade of the month
Got in around $82.2. J is now testing the next resistance at $85 soon and target 1) $90 and 2) $97 by next month and cut loss at $73.
Literally everything has been up this month so be greedy when the market is up.

A Scenario For Growthingif bottom line of channel dont work as a resistance this stock can easily growth to midline and top line of channel.also RSI is in good condition and its on Resistance. another Important Note is That Moving Average Expoteineal in 200 Day is under Candle that is very Good point. 80 percent growth can be happen
