0JVT trade ideas

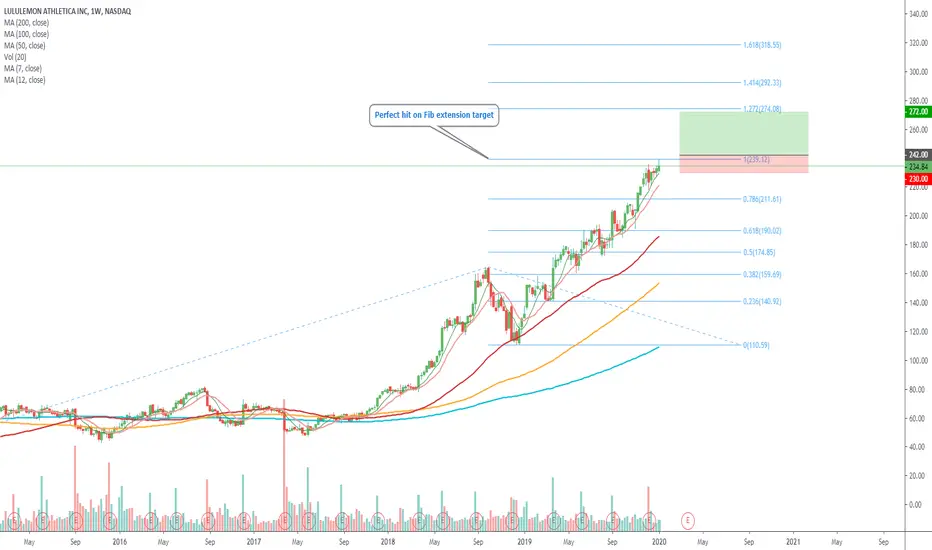
LULU target price $272Entry level $ 242 = Target price $ 272 = Stop loss $230
P/E ratio = 54
Short interest = 2.66
Average Recommendation:Overweight Average Target Price:$245.74
18 BUY
01 OVERWEIGHT
11 HOLD
01 SELL
Company profile
lululemon athletica, Inc. engages in the designing, distributing and retail of athletic apparel and accessories. It company operates through the following business segments: Company-Operated Stores, Direct to Consumer. The Company-Operated Stores segment comprises of lululemon and ivivva brands; and specialize in athletic wear for female youth. The Direct to Consumer segment is involved in e-commerce business. The company was founded by Dennis J. Wilson in 1998 and is headquartered in Vancouver, Canada.
PLEASE GIVE US A LIKE IF YOU FIND OUR CONTENT HELPFUL, IT IS REALLY APPRECIATED
LULU -- going strong upwards trends -- may regroup as well.LULU -- going strong upwards trends -- may regroup as well --- riding parallel channels since March 2019

Lulu incredible run strengthStill in channel pattern for now.... growth still room but may pull back a bit too in between channel....
Must says it has been an incredible ride with it

$LULU Monthly Analysis Potential buy opportunity after pullback.
lchimoku Cloud indicates high buying volume & momentum.
Flat 9 day MA indicating a pullback.
Moving average & price disequilibrium.
Lagging span still has a bit of momentum
26 day moving average high momentum.
Price is expected to drop & pullback to higher highs.

$LULU Filled the top gap, watch for break to fill bottom gap.Top gap was filled, looking for a breakdown to fill bottom gap. Picked up some cheap Feb puts around the gap price.

LULU Bullish shorter term Bearish medium termSo this trade opportunity is a bit risky, because price action is likely going to continue to make lower lows over the next several months, possibly targeting the 211 level. I'm not trading that move lower, but aware that it is likely. However, I'm interested in a shorter term trade higher to target the 230.57 level over the next several days to possibly next few weeks. Watching price action here...The idea is higher to 230 and then lower to 211. We will see.

LULU Pennant Breakout (down)Dropped on poor guidance, formed a pennant and appears to be heading down.
Target is $215 support


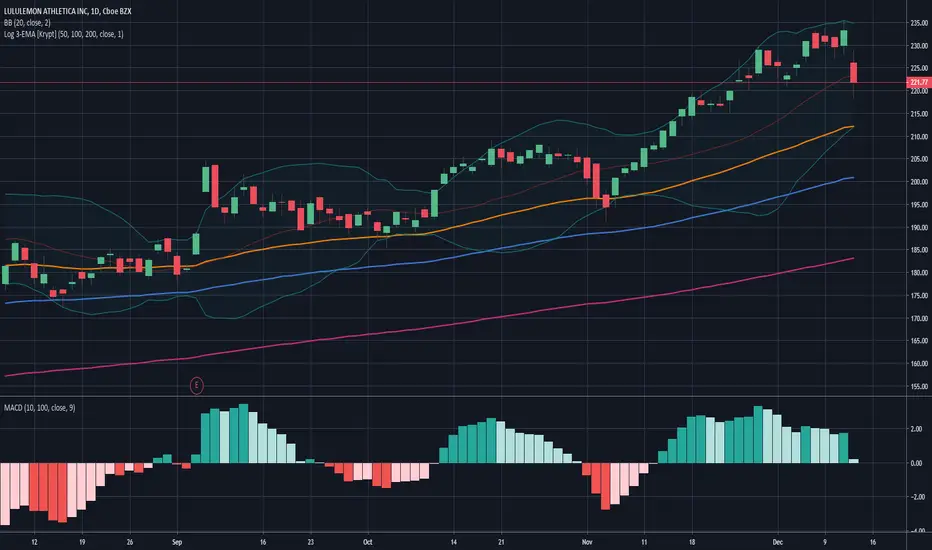
LULU Drop Not Over Yet TP @ 212-213We will continue the drop to the bottom of the Bollinger bands which coincidentally also the 50 Log-EMA level which should provice some resistance and hopefully we bounce back from there.
If you also long from that point put your SL below the band and the EMA.
LULU just normal regrouping....if fall below 217 to regroup....LULU just normal regrouping....if fall belo 217 to regroup.... it will go down to 204 range to test.... as it is way above100 MA averages..... IMO

$LULU Levels to watch tomorrow One of the hottest stocks of 2019 is having a little stumble in the after-hours post earnings.
Thursday we will see is it a buy the dip or cash in opportunity.
Coming into year end it is understandable that some profit taking could occur with $208 as golden pocket support.

Short LULUSolid short sell setup with 4.236 fib extension of 2013/2014 range + bearish RSI & MACD divergences
Buy insurance with time and it should be a lucrative trade

LULU - interesting point NOW ---- to go up or downLULU - interesting point NOW ---- to go up or down - Lulu Lemon has provided a very strong run and showing no signs of stopping ---- But I wont hold my breath forever - as it may need to come down a bit to regroup and then rise again.
They point in the chart may tell more if it breaks again upward across the LINE upward..... predictable channel so far.


Possible H&S pattern forming on LULU ahead of earnings.LULU has been on an impressive run since early November, but with the impending earnings report(~Dec 11) there has been some question as to whether earnings will justify this growth. Starting on around Nov 22 it appears that a pretty classic head and shoulders pattern has formed with a strong neckline at ~222-223. Indicating a potential down turn in the coming days.
This pattern also coincides with a break from the previously strong channel that LULU was following.
I will be watching this stock closely to see how the pattern completes as we approach earnings next week.
We are all learning here, so please comment below with your thoughts. And as always, I am not your financial advisor, go ask your Daddy for stock tips.

LULU still inline with a WEEKLY channel pattern (on a BIG SCALE)LULU still inline with a WEEKLY channel pattern (on a BIG SCALE) ------ when looked over the past years. Still positive it can ride the upward channel or soon bounce to the lower side of the Channel visible....as a pull back. RSI riding overbought for the past week. LULU is 10% above the 10MA - Moving Average. Seems quite high on the weekly charts now. But this stock keep surprising and defying the odds rising higher....

LULU going rogue.... Pattern has fallen off...Pattern is not being followed now ---- This is one stock that doesn't want to stop rising... but with all stocks what goes up will go down. It is not IF, but when. Which is healthy to regroup. Not a bad thing. We shall see when...

LULU in Speculative Run at New HighLULU has been trending upward and gaining momentum as it enters a new all time high price level.


