LULU daily bullish hammer at long time supportOrder BUY LULU NASDAQ.NMS Stop 300.60 LMT 300.60 will be automatically canceled at 20230401 01:00:00 EST
LULU daily bullish hammer at long time support conservative stop, quick 1.2R countertrend
0JVT trade ideas

$LULU GAMEPLAN I am looking for a pullback on LULU here around 284 and if not then 297. Once we have a confirmed rejection off one of those lvls we can snag some puts and we can go for a short position

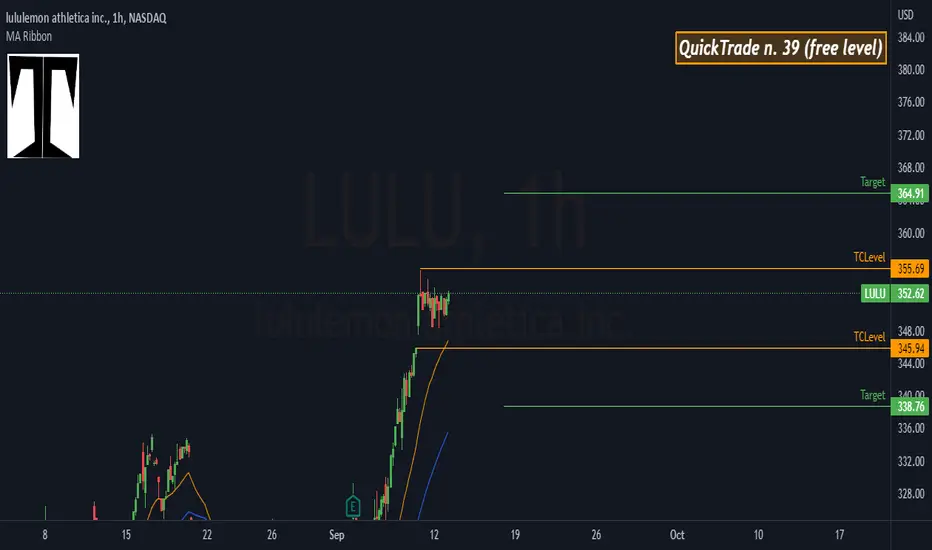
QuickTrade n. 39 on LULULooking for a continuation of the most recent breakout.
The short side sees a pullback AT LEAST on the 50h
$LULU with a Bullish outlook following its earnings #Stocks The PEAD projected a Bullish outlook for $LULU after a Positive over reaction following its earnings release placing the stock in drift B with an expected accuracy of 100%.
LULU shortLULU pi RSI is at 100 on the 1hr chart. A short entry trade is on my radar. Especially going into next week's macroeconomic Calendar events.
Do your own due diligence, your risk is 100% your responsibility. This is for educational and entertainment purposes only. You win some or you learn some. Consider being charitable with some of your profit to help humankind. Good luck and happy trading friends...
*3x lucky 7s of trading*
7pt Trading compass:
Price action, entry/exit
Volume average/direction
Trend, patterns, momentum
Newsworthy current events
Revenue
Earnings
Balance sheet
7 Common mistakes:
+5% portfolio trades, capital risk management
Beware of analyst's motives
Emotions & Opinions
FOMO : bad timing, the market is ruthless, be shrewd
Lack of planning & discipline
Forgetting restraint
Obdurate repetitive errors, no adaptation
7 Important tools:
Trading View app!, Brokerage UI
Accurate indicators & settings
Wide screen monitor/s
Trading log (pencil & graph paper)
Big, organized desk
Reading books, playing chess
Sorted watch-list
Checkout my indicators:
Fibonacci VIP - volume
Fibonacci MA7 - price
pi RSI - trend momentum
TTC - trend channel
AlertiT - notification
tickerTracker - MFI Oscillator
www.tradingview.com

US Stock In Play: $LULU$LULU - Consumer Cyclical | Apparel Retail
breakout of year long bullish wedge pattern, retaking its 200MA, AVWAP from ATH and YTDH with higher lows since late may'22.
latest ER on 1/9 reports continual YoY growth for both EPs (+33%) and Sales (+29%)

Earnings watch 6/2Earnings watch 6/2:
DLTH
PD
RH
OKTA
HRL
TTC
LULU
CRWD
COO
LE
Do your own due diligence, your risk is 100% your responsibility. This is for educational and entertainment purposes only. You win some or you learn some. Consider being charitable with some of your profit to help humankind. Good luck and happy trading friends...
*3x lucky 7s of trading*
7pt Trading compass:
Price action, entry/exit
Volume average/direction
Trend, patterns, momentum
Newsworthy current events
Revenue
Earnings
Balance sheet
7 Common mistakes:
+5% portfolio trades, capital risk management
Beware of analyst's motives
Emotions & Opinions
FOMO : bad timing, the market is ruthless, be shrewd
Lack of planning & discipline
Forgetting restraint
Obdurate repetitive errors, no adaptation
7 Important tools:
Trading View app!, Brokerage UI
Accurate indicators & settings
Wide screen monitor/s
Trading log (pencil & graph paper)
Big, organized desk
Reading books, playing chess
Sorted watch-list
Checkout my indicators:
Fibonacci VIP - volume
Fibonacci MA7 - price
pi RSI - trend momentum
TTC - trend channel
AlertiT - notification
tickerTracker - MFI Oscillator
www.tradingview.com

LULU: Fade the rally!Lulumelon Athletica
Short Term - We look to Sell at 329.26 (stop at 346.16)
They reported better than expected earnings and the stock jumped up premarket. The medium term bias remains bearish. We are assessed to be in a corrective mode higher. Bespoke resistance is located at 332.00. We therefore, prefer to fade into the rally with a tight stop in anticipation of a move back lower.
Our profit targets will be 284.68 and 272.00
Resistance: 332.00 / 410.00 / 478.00
Support: 283.00 / 246.00 / 129.00
Please be advised that the information presented on TradingView is provided to Vantage (‘Vantage Global Limited’, ‘we’) by a third-party provider (‘Signal Centre’) . Please be reminded that you are solely responsible for the trading decisions on your account. There is a very high degree of risk involved in trading. Any information and/or content is intended entirely for research, educational and informational purposes only and does not constitute investment or consultation advice or investment strategy. The information is not tailored to the investment needs of any specific person and therefore does not involve a consideration of any of the investment objectives, financial situation or needs of any viewer that may receive it. Kindly also note that past performance is not a reliable indicator of future results. Actual results may differ materially from those anticipated in forward-looking or past performance statements. We assume no liability as to the accuracy or completeness of any of the information and/or content provided herein and the Company cannot be held responsible for any omission, mistake nor for any loss or damage including without limitation to any loss of profit which may arise from reliance on any information supplied by Signal Centre.

9/1 - Lulu Pre-Earnings Analysis Higher probability of downside move with Lulu earnings scheduled evening of 09/01:
1. Multi-month head and shoulders was cleanly pierced and then retested with downward pressure from its base.
2. Multi-week down trend off of 200 SMA.
3. Multi-day weakness leading to today, with overall rounding of price to the downside.
4. Multi-year support would occur around 245.
5. General market weakness and downward revisions from retailers.
Conclusion: Earnings volatility on 09/02 could see test of $245.

$LULU calls WE HAVE Basically already closed above resistance here WE NEED 1-2 candles on the daily above this lvl to ensure that this isn't just a fakout! There is a lot of range above resistance that we can play with

LULU Base breakoutLULU getting near base breakout. If market stays strong next week, LULU can breakout over 313. Keep in mind that market is extended for now. So risk is elevated for longs here compared to last 2 weeks.
AUG 5 220C can work

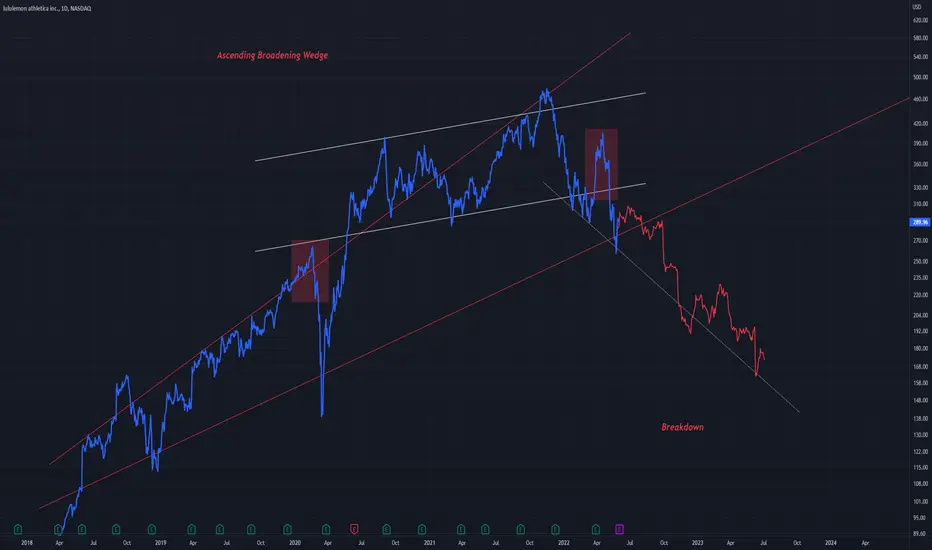
Bearish Wedge Sell Points (in red)Two different types of Wedges both showing a similar sell point entry
The sell point is right below the wedge, so if a breakdown occurs, a retest and consequent rejection follows
This is common between both wedge patterns
From personal experience I have seen Rising Wedges act more bearishly than Broadening (megaphone) structural wedges
However both of them have the potential to be bearish.

ASCENDING TRIANGLEInteresting accumulating area that could end up being an ascending triangle bullish pattern if price closes above 307 resistance level, suggesting a long with 1.8 R/R.
Bullish divergence is also seen.

breakoutInteresting accumulation area that would suggest a 1.8 R/R in case of more upward pressure to develop further after the resistance break

$LULU with a Bullish outlook following its earnings #Stocks The PEAD projected a Bullish outlook for $LULU after a Positive over reaction following its earnings release placing the stock in drift B with an expected accuracy of 100%.

LULU inside weekInside week on LULU and also forming a triangle pattern. Top of the trendline and 50DMA are pretty close to each other. Most of the names had inside weeks last week and we have FED on Jul 27th. The only thing i am thinking about is if market moves past its range this coming week or the week after when FED makes an announcement but nonetheless these setups can be played either way.
If LULU breaks out, JUL 22 295C can work. There is a gap to fill 293.39 and then another gap 297.50 - 302.13 which can be targets
If it gets rejected from 50DMA or top trend line can try 280P for a trade down to the opposite side of triangle.

LULU - Above Up Channel LULU has formed a megaphone pattern above the top of a dominant up channel
This up channel may act now as support on this 3D chart
Earlier price formation shows a symmetrical triangle


BOS CHOCHBreak of structure /Change of Character
Break below lower high. When price goes from new Higher high + break of structure low = Changer of Character
Waited for pullback on 30min chart.
Brought puts on continuation lower than 30min pullback candle.

LULU Bearish DivergenceLULU finding some resistance within the Volume profile POC and showing a ROC Divergence here. The ROC showing lower high readings as LULU continues in the short term uptrend, a negative for any continuation here. Expecting a test of the VAL (286). I think this 286 wont be a strong support either and might see a stronger support at 250.

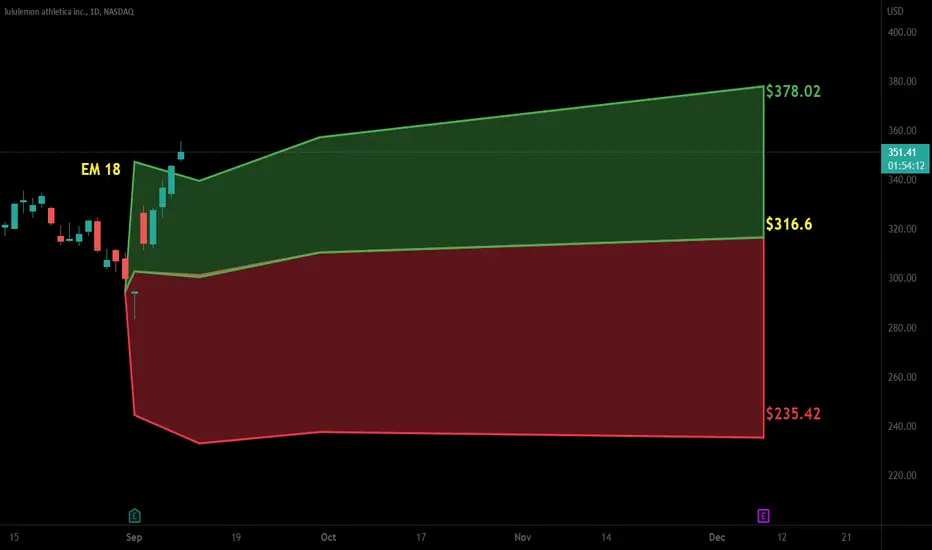
LULU | GuidanceJournal Entry
Bias: Positive.
Sentiment: Optimistic.
Emoji (emotion): Patient🧘♂️.
Null Hypothesis: Buy.
Alternative Hypothesis: Sell.
Signals: Several MA Crosses, %B +Band walking, Bandwidth approaching a pivot point.
Position: Swing trade.
Notes: I'm anticipating the market to buy/sell the earnings surprise 6/02/22 AMC: www.estimize.com
Barron's Company Overview: www.barrons.com .
Other: I do not advise an option trade for LULU the volume & open interest are too low and the BidxAsk spread is too wide.
Tutorial: (Q/A) What exactly is the box labeled tolerance? The box labeled tolerance is a defined range of value & time that qualifies the right to exit the trade after a profit is made; as long as the security is inside the box and above the trade's entry one could say the profit is within tolerance, likewise if the security is outside the box either because of value or time one could say the profit is not within tolerance. It's a way to add parameters to the future outcome (as a means to grade the journal entry) while simultaneously providing leniency in the ability to achieve success with said journal entry.
About the Security: "lululemon athletica, Inc. engages in the designing, distributing and retail of athletic apparel and accessories. It operates through the following business segments: Company-Operated Stores, Direct to Consumer. The Company-Operated Stores segment comprises lululemon and ivivva brands; and specialize in athletic wear for female youth. The Direct to Consumer segment is involved in the e-commerce business, building brand awareness, particularly in new markets. The company was founded by Dennis J. Wilson in 1998 and is headquartered in Vancouver, Canada."
About the Author: I'm happy to hear from my readers/audience and I encourage constructive feedback; although I'm busy I will give my best effort to reply. I do strive to build an esteemed reputation with a prolific following and earn the titles of a Tradingview Wizard & Top Author; along those lines I'm a financial scientist and my contributions offered to the community are apart of my scientific journal or goodwill to mankind.
Disclaimer: My journal entry is not a complete prospectus, please consider it accordingly.

LULU is going downLULU has weakening momentum, a long term H&S and volume cueing in a downside move. You can see that historically, LULU likes to make H&S patterns with the neccessary retest at the end of the H&S slightly overextending the trendline before capitulating. Taking a long-term short for a few months out is my play of choice. A calandar spread is a good way to hedge but with the potential for capitulation, I think an ATM or Slightly OTM naked put is the best strategy to go with.

LULU - Ascending Wedge BreakdownA symmetrical triangle can be seen acting bullishly, pushing the price into a rising broadening wedge
I believe this wedge to be a bearish pattern, as I have indicated with the bars pattern (which is just a rough estimate of how a down move will persist)
Daily chart