0JZ0 trade ideas

MLM Failed Breakdown AttemptWouldnt say it has completely failed yet, but it has come back to retest before possibly making a move lower. It did not breakdown or retest with any significant volume. Market of course heloing bring it back up, but until we see some volume coming into it, i think we wont see a major move anytime soon.

#MLM #long #stockMLM has formed a double bottom. All indicators look good. Weekly and Monthly time frame analysis look good.
Weekly
As you can see the stock has formed a series of higher highs and higher lows. MACD and Stock RSI look good. OBV is seeing some recovery.
Monthly
As you can see, MLM has formed a cup and tiny handle. all the indicators look good.


Trade Idea --- 8/10 Weekly and Daily breakout ---This is looking like a high probability trade setup. As long as there is no sudden rejection this week I think this one is in the clear to move higher. We may see a few days of consolidation, accompanied by candles with "scary" wicks, following the large price movement that we have seen thus far.
RSI breakout on the daily.
MACD zero line cross on the daily
On above avg volume(but see the note on the chart)
GMMA traders(Blue MAs) are compressed showing a move may occur soon(up or down; betting on up)
-------------
RSI breakout on the weekly
GMMA traders and investor(orange) groups are converging. As the MAs compress the likely hood of an explosive move is high.
S&P IQ has a 5 star rating on them with a PT of $240. Additionally they are currently trading 16% below fair value according to their analysis. They have seen good growth(% wise for a midcap) in recent quarters, which can later be a good driver when the market is ready.
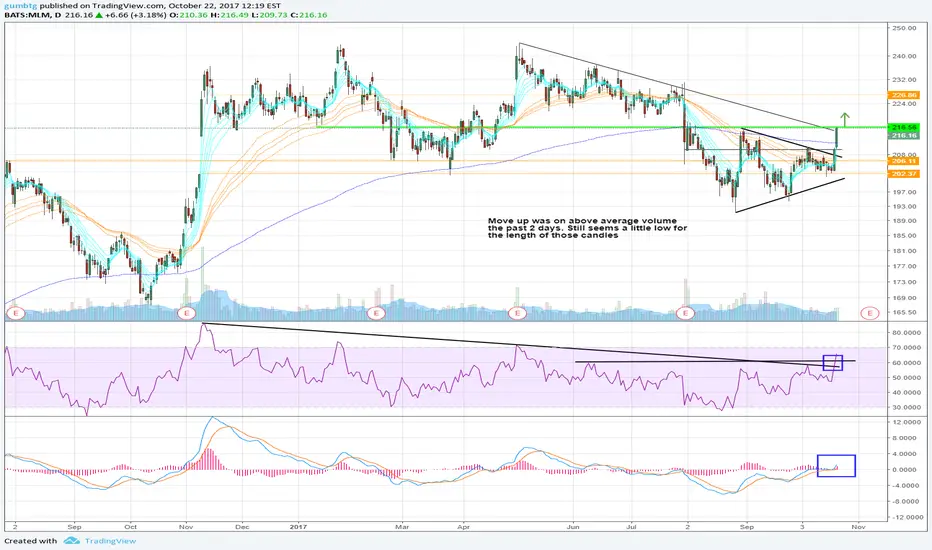


Swing Trade Idea --- $MLM ---Details posted on the chart.
-I am a fan of this chart. Not the kind of trade I would normally look at, but none the less I think It has potential to swing to the upside. Set an alert at the line breakout levels and consider buying when the technicals confirm the entry.
-Always look for volume to confirm.
-The orange and blue MAs are part of the GMMA methodology, created by Daryl Guppy
Follow for more.
As always comments are welcomed and appreciated.


MLM Short @ 210?Currently in a short-term downtrend following hitting the 1.618 fib target. However the support level around 207 has been holding and there is also a upward sloping trendline that will soon provide additional support (or break and help push the price below 207. Entry at 210 for a short was decent although I don't see the rationale for that particular point of entry.

Buy Signal for Martin Marietta MaterialsMoneyHour$-Breather signals a Buy for MLM - always use a Stop Loss with 8% and wait for Sell signal of my Breather
My Market Breadth calculation shows a positive (green) environment


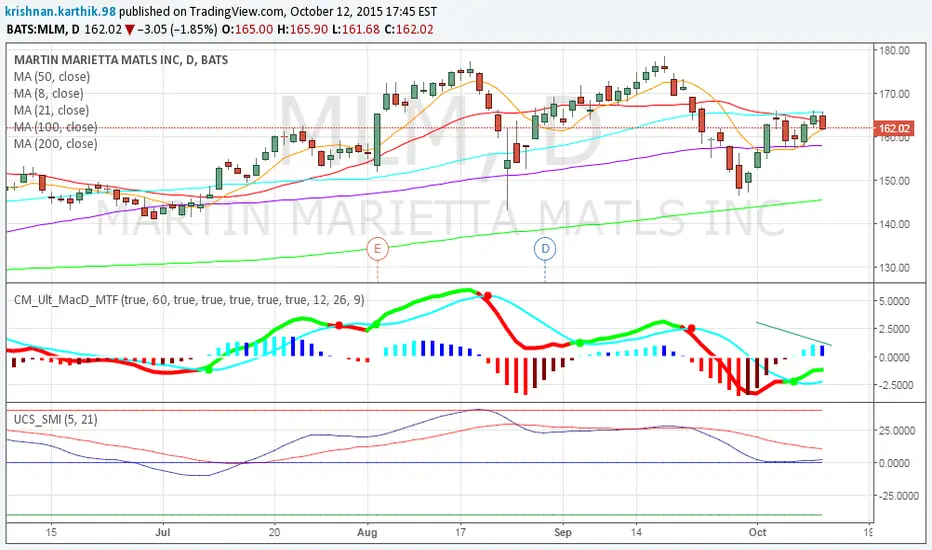
short mlm for a few daysa huge selling is being expected for martin marietta materials(mlm) , according to hourly the macd has been showing a great bearish divergence, a strong reversal from 200 sma in hourly with already strong sell in the daily timeframe just below 50 sma which is at $165.76.
in the 30 min timeframe macd has already crossed below 0 and hoping around 50 sma which shows a huge upcoming smashing waves to downwards.
1st target- 158 ( at 100 period sma of daily timeframe)
2nd target- 145( around 200 sma of daily).
stop just above 165-166( above 50 sma of daily timeframe)