MCK month of consolidation...If price break to news highs, could see a quick move towards $350 (at least)
Very defined Support as well, if price comes back down to support and rejects, could be also a trade idea.
Adding alerts both at support and resistance
0JZU trade ideas

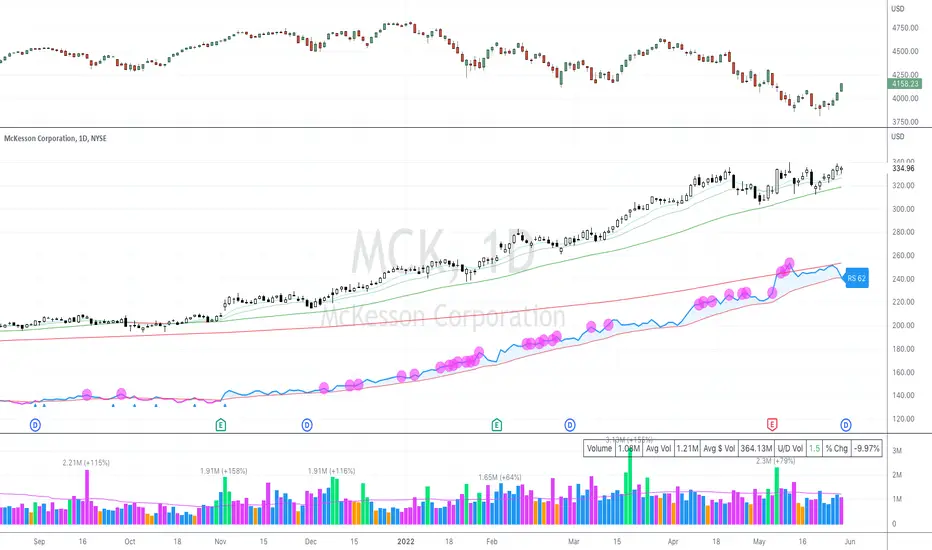
MCK , LONGBeen watching this one for all of 2022 and now we have an entry .
50 sma take back, hammer today and WP yesterday too . Also market went into GTM today with the wedge pop on QQQ.
I like how MCK managed to keep it together in this TTR too, strength~
Entry 320.73
Stop 309.57
PT 1 - 331.76

Another OutbreakWe've just got a new with a good short term momentum. It's up to our taste what we expect. At least some more pips seem to be available.

MCK Breakout BullishMcKeeson Breakout of ascending triangle.
Volume has dried up nicely as pattern has been forming.
In a good sector and breaking out to new all time highs.
Watching RSI and MACD for profit targets.
Breaking out on 25th of July was on above average volume giving more conviction behind the move.

MCK Breakout TradeMcKesson is breaking out from a textbook volatility compression pattern. After a strong run higher in Q1, shares have formed a base with pullbacks shallowing from 12% to around 6% - a sign that sellers have been exhausted and supply is no longer coming to market. This will allow the stock to accelerate freely as demand increases for this stock.
Fundamentals look decent with steady earnings and sales growth. Additionally, the medical sector is showing strength in an otherwise weak market, and McKesson is a strong name to own in order to play that trend.
MCK broke out Monday on good volume above its resistance level. Traders can buy the stock here with a 7% stop to see if this move has legs.

Rectangle//Rising Wedges Below Price.This stock has been an amazing performer with a very long rise up and a bit steep at times.
There appears to be a lot of buyers inside this stock.
Yearly and 3 year low is 112.60.
Rectangles are horizontal trading channels and are neutral until a trendline is broken. Price can stay inside this channel for quite a while bouncing up and down between trendlines. It will eventually break one way or the other.
I personally do not like these at a possible top, but it is a neutral pattern.
There are several rising wedges below price. Some are well below price and I see one under $200. I drew one rising wedge that I saw in this chart as I did not feel like spending the entire morning drawing rising wedges (o: A rising wedge is a bearish pattern and both trendlines slope up then converge at the apex. Rising wedges create a supply overhang at that level. A rising wedge is not valid until the bottom trendline is broken. From what I have noted, it could be months, years or just days, but the trendline of a rising wedge is eventually broken. I do not like rising wedges below me, but we are all different.
Short interest is 1.71%
Bullish Marubozu candle today with both ends shaven right this second. That can change by close.
The 20 DMA crossed down through the 50, but the 20 looks as if it it pointing upward toward the 50 again. It may or may not make it up there.
Time will tell.
If price breaks the top trendline convincingly, then possible targets are above the rectangle.
If price breaks the bottom trendline and forms a convincing downtrend, then this would be called a Rectangle top, and possible targets are below the rectangle.
No recommendation.

MICK: bullish megaphone pattern?A bullish trend is applicable above 320.00 Crossing below this level will negate the bullish stance.
Further bullish trend support above 325.50.
Consolidation range between 324.00 to 332.00.
Crossing above 332.00 might target 344.50.
Crossing below 324.00 might be the first glimpse of weakness.
A bullish megaphone pattern might be applicable.

$MCK with a Neutral outlook following its earnings #Stocks The PEAD projected a Neutral outlook for $MCK after a Negative over reaction following its earnings release placing the stock in drift C with an expected accuracy of 100%.

SELL MCK SUPPORTMCK stock price is losing momentum and indicating a trend reversal, fear leads to panic selling as fed will most likely raise the interest rates by >=50bps

MCK High-risk Initial LongMCK High-risk Initial Long. SL and TP on the chart. 10-20x leverage. Move SL on TP.

MCK still going through some screens but so far nothing really jumps out at me.. oil and gas still the leading industry but all ST extended to me.. no setups at the moment.

$MCK#$MCK
Looks strong in bars.
Broke box.
I need it to cross 340 .
Good support at 9 and 21 EMA
More green bars in box than Red

MCKMCK closed at 318.18. MCK presents an interesting short oppourtunity after putting in a potential topping pattern at 320, near the 1.0 fib off of it's monthly move. MCK can break below 317.43, then move to test 313, and more likely 302. MCK has been extraordinarily extended, and is ready for a larger pullback. If MCK can clear 322, I would avoid puts.

McKesson Corporation - MCKHere we have a great opportunity for stock growth.
If the trend continues, the target price would be 80% of the current over a period of up to 2-4 years.
It is only for long-term investors.
Good luck with trading !!!

An Investment Masterclass, Part 2.Additional avenues for analysis - considering more the market space and the peer set, diving more into growth prospects and other analyst commentary, and understanding the context for which multiples change and how you can be prepared for that.
Cheers!

the b[AI]te's weekly insights -- MCK 2021-03-01center stage attention
stock
our system found that MCK received most attention over the course of last week.
comment image
we see a moderate negative correlation with our image indicator. We therefore assume that prices are driven partial emotionally as there is probably some other catalyst with regard to the company resulting in an uncertain pricing.
new free tool
we launched our new free analysis tool. Check our website and test it out!
new free and powerful data API
you can now access our data via our free API . Check our website and test it out!
FAQ
ATTENTION
our algorithms define ATTENTION as the overall number of stories and opinions that appear for a given security each day.
IMAGE
our algorithms define IMAGE as the averaged sentiment value extracted from all opinions received for a given security per day.


DGX-0.748*MCK $MCK Mckesson Corp vs. $DGX Quest DiagnosticsQuantamental Tools for Proprietary and Retail Investors.
Statistical Arbitrage Opportunities Delivered to Your Inbox.
QuantChart. io
Long 1000 $DGX
Short 748 $MCK
Mean Reversion Time: 14 Trading Days

MCK, Triangle Descending (bullish) I found this pattern at tickeron website with the following data:
STATUS = Confirmed
CURRENT CONFIDENCE = 73%
TARGET (EXIT) PRICE = 153.70 USD
BREAKOUT (ENTRY) PRICE = 150.08 USD
DISTANCE TO TARGET PRICE = 0.31%
EMERGED ON = Oct 02, 08:00 AM (EDT)
CONFIRMED ON = Oct 06, 09:32 AM (EDT)
WITH CONFIDENCE LEVEL = 79%
The Descending Triangle pattern is formed when the price of a security establishes a support level (1, 3, 5) and bounces off that level to a declining resistance level, creating a down-sloping top line (2, 4). The breakout can either be up or down, depending if the resistance or highest support level is broken first.
This pattern is commonly associated with directionless markets since the contraction (narrowing) of the market range signals that neither bulls nor bears are in control.
Trade idea
Once the price breaks out from the top pattern boundary, day traders and swing traders should trade with an UP trend. Consider buying a security or a call option at the breakout price level. To identify an exit, compute the target price by adding the pattern height from breakout point. For upward breakouts the level is the highest high within the triangle (2). Pattern height is the difference between the level of the bottom horizontal line and the highest high.
To limit potential loss when price suddenly goes in the wrong direction, consider placing a stop order to sell at or below the breakout price.


MCK - 7.88% Potential Profit - Bullish PennantUptrend Support with a bullish pennant forming about to breakout.
Target price set at March's high.
- 5-month uptrend
- RSI and STOCH well above 50
- MACD well above Signal
Suggested Entry $159.35
Suggested Stop Loss $155.97
Target price $171.72
Note that I tend to adjust stop losses in order to secure profits early and preserve capital. This means that the target price is going to be achieved as long as there are no strong pullbacks that trigger my new adjusted stop loss.
