OMC could soar from here! 50% higher this year?Looking at the OMC chart on an extended timeframe, an obvious harmonic pattern jumps out. I think it could replay this year. 50% higher from here wouldn't be unprecedented.
0KBK trade ideas

$OMC with a bullish outlook following its earnings #StocksThe PEAD projected a bullish outlook for NYSE:OMC after a negative over reaction following its earnings release placing the stock in drift C with an expected accuracy of 42.86%.

Stocks pairs trading: IPG vs OMCComparing the financial metrics and market dynamics of Interpublic Group (IPG) and Omnicom Group Inc. (OMC) provides valuable insights for investors contemplating their investment choices.
Reasons to Consider Buying IPG Over Selling OMC:
Valuation and Growth Prospects: IPG's forward P/E of 10.60 compared to OMC's 11.53 indicates a slightly more attractive valuation for IPG. Additionally, IPG's expected EPS growth next year of 6.79% against OMC's 7.39% is fairly comparable, suggesting both companies are expected to see growth, but IPG's lower valuation makes it slightly more appealing.
Market Performance and Recovery Potential: Despite IPG's performance over the past year showing a decline of -7.98%, its half-year performance has been positive, with a 12.26% increase. This suggests a recovery trajectory that might appeal to investors looking for companies with momentum. OMC, while having stronger performance indicators in the short term, might already have much of its growth potential priced in, given its higher valuation and recent market performance.
Dividend Yield and Financial Health: Both companies offer attractive dividend yields, with IPG at approximately 4.04% and OMC at 3.10%. However, IPG's lower P/E ratio combined with a solid dividend yield may offer a better risk-reward balance for dividend-seeking investors. Furthermore, IPG's payout ratio and financial health indicators, such as its debt to equity ratio, suggest a potentially more sustainable dividend payout in the longer term.
Reasons to Consider Selling OMC:
Relative Valuation Concerns: While OMC shows robust performance and a solid growth outlook, its slightly higher forward P/E ratio suggests that its stock might be more fully valued compared to IPG. For investors seeking value, this might make OMC a candidate for selling, especially if the goal is to reallocate capital to more attractively valued opportunities.
Market Sentiment and Performance Peaks: OMC's recent strong performance, with significant gains over the past half year, might lead to concerns about the sustainability of its stock price momentum. Investors might consider whether now is an opportune time to lock in gains from OMC before reallocating to stocks with more perceived upside or less aggressive market expectations.
Sector and Economic Sensitivity: Both companies are sensitive to economic cycles and shifts in advertising spending. However, given OMC's recent run-up, it might be more vulnerable to market corrections or shifts in investor sentiment if economic conditions change or if there's a reassessment of growth expectations in the advertising sector.
Decision:
Buy 3 IPG: Given IPG's relatively more attractive valuation, signs of performance recovery, and its dividend yield, it represents a prudent buy for investors looking for value and growth in the advertising and marketing sector.
Sell 1 OMC: Considering OMC's recent strong performance and higher valuation, investors might view this as an opportunity to realize gains.

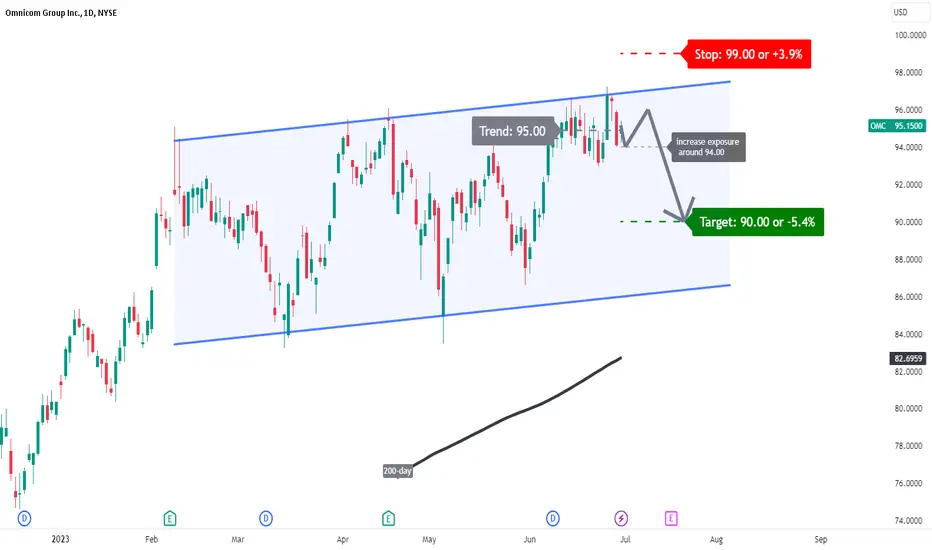
OMC: temporary correction?A price action below 95 supports a bearish trend direction.
Bearish confirmation further supported for a break below 94.
Teh target price is set at 90.
The stop-loss price is set at 99.
A temporary correction in an inclining channel pattern seems likely.
OMC - Extended Right Arm of W PatternOMC has a nice W pattern angled right here.
I expect the right arm of the W to extend higher than the rest.
I have shown this extension to resistance in thick green, with the bars pattern tool.
Numbers 1,2,3 are just counting the W pattern.

$OMC with a Bullish outlook following its earnings #Stocks The PEAD projected a Bullish outlook for $OMC after a Positive over reaction following its earnings release placing the stock in drift B with an expected accuracy of 75%.

OMC - Ascending Triangle Breakout PotentialOMC has formed a large Ascending triangle / bullish rising wedge on this 3D timeframe This will likely break out to the upside as indicated by the double curve

$OMC with a Bullish outlook following its earnings #Stocks The PEAD projected a Bullish outlook for $OMC after a Positive over reaction following its earnings release placing the stock in drift B with an expected accuracy of 71.43%.

QuickTradeStop at $68.
Bullish cross already happened.
Not a good looking RSI
Don't let the white cross down the blue EMA.

Long | OMCNYSE:OMC
Possible Scenario: LONG
Evidence: Price Action
TP1~ 82.80$
Call options, Strike 80$, 05/21/21
This is my idea and could be wrong 100%,


OMNICOM GROUP View Hey people, OMNICOM GROUP is in a bullish movement with indecision candle and abnormal volume executed. TheTIMEFRAME M1 makes us observed a hammer candle which bounces on the VWAP with a huge volume of purchases made. There is a good chance to test the comfort zone then the breakout and land in another and go towards the last one above (See MULTI TIMEFRAME). With closing a bearish breakout gap and if the buyers are really in the game test the TIMEFRAME H1. For the breakout of the comfort zone and headed for symbolic number 68.00.
Please LIKE & FOLLOW, thank you!

A safe long term hold OMC has an annual earnings per share of 6.08 giving it a P/E ratio under 10 (9.1). They payout 42% of their earnings through dividends(4.7% yield) and another 40% through buybacks. It’s long term annual growth is expected to grow 2.5% or 5.5% when including buybacks. Last recession their eps went down to a low of 22% of which completely recovered after 2 years. Their last eps has only been slightly affected but we shouldn’t be surprised if earnings continue to fall.
Their book value per share or margin of safety is $13.65 and their cash flow is $2.6 a share. Return on assets is 5.4%, debt to equity ratio is 2, current ratio is .92 and P/S is .82 (.75 is industry average).
OMC is in the business of advertising and marketing. This is a brief analysis and you should always look more into the details of a company before becoming an owner of them.

No Omni Direction. Just Upward!What I see...
+ 10ma is crossing above 50ma
+ Hammer with long shadow finding support on the MA cross
+ This setup is a risky reversal gamble!!
+ MACD is above signal line, but still in bearish territory
+ Bearish engulf bar was at normal vol. while the bars prior and after are of high volume
- Bearish engulfing on -2d
- Down trend
- Bollinger is wide
- RSI is pointing south
- MACD is also in bearish territory
What I setup...
+ Long entry above -2d Open
- Stop underneath the Hammer
+ Target at 61
:: Duration - 5 to 10 sessions
** Comments and Likes are appreciated; New Subscribers are OMNI! **

Omnicom Group Inc (OMC - US) WXY down Omnicom Group Inc (OMC - US) is in WXY pattern. X wave is completed as complex wave. Y wave down is in progress now. Sell after some pull back with X wave high as stops.


Thank You!Merry Christmas and Happy New Year!
Thank you for the continued community support throughout twenty-nineteen, I'm humbled and grateful for the positive feedback.


OMC Symmetrical TriangleNeutral pattern until decisive close outside pattern. SP is near bottom upward monthly trendline. May be a good buying opportunity for a decent long term dividend paying stock with divi growth of 9 years.


NYSE - short volatility ideas - bearish batchCPB
EQT
OMG
All these three have good trading volume , very tight bid-ask spread and higher-than-normal realized volatility .
These three have also in common good bullish expectations, technically speaking.
Bottom line is: sell calls on these three.
Trade responsibly

OMC is ready again.retest of ih&s, rest at fib level, risk reversal and call spread bought, this baby is ready.
