ServiceNow Is Our Top Tech Compounder PickIn a tech world often driven by hype and speculation, ServiceNow NYSE:NOW stands out as a reliable growth engine—a true compounder. Unlike flashier tech names, ServiceNow delivers steady revenue growth and expanding margins, all while offering mission-critical software to businesses.
📈 What’s a
Next report date
—
Report period
—
EPS estimate
—
Revenue estimate
—
8 USD
1.43 B USD
10.98 B USD
207.02 M
About ServiceNow, Inc.
Sector
Industry
CEO
William R. McDermott
Website
Headquarters
Santa Clara
Founded
2004
FIGI
BBG00JVRJHC3
ServiceNow, Inc. engages in the provision of an end-to-end workflow automation platform for digital businesses. Its Now Platform is a cloud-based solution embedded with artificial intelligence (AI) and machine learning (ML). The company was founded by Frederic B. Luddy in June 2004 and is headquartered in Santa Clara, CA.
Related stocks

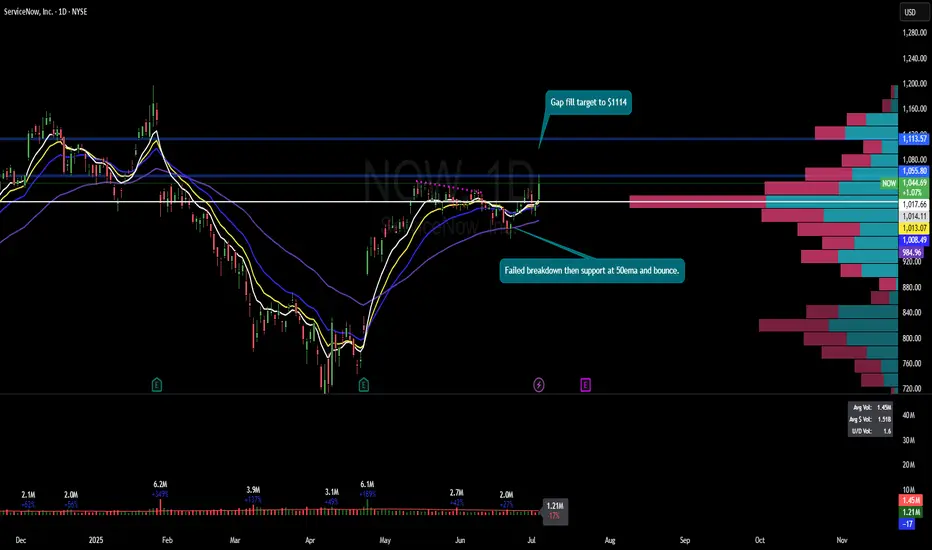
$NOW $1114 pt?NYSE:NOW had failed breakdown then bounce at 50ema on daily and it had recaptured 8ema and 21ema on daily. Gap fill target remains to $1114.
ServiceNow Is Up Some 55% Since April. What Might Happen Next?ServiceNow NYSE:NOW has risen nearly 55% in the past three months as the AI-focused business-management firm and member of the S&P 500 SP:SPX gained ground ahead of and following its well-received Q1 earnings. With Q2 earnings due out later this month, what does the stock's fundamental and techn

ServiceNow Has Been RestingServiceNow has been resting for months, and now some traders may think the software company is ready to move again.
The first pattern on today’s chart is the price area around $960. It was the peak in late April and the low early last month. NOW pulled back to hold that level yesterday and bounced.

NOW watch $805: Major resistance zone to break could pop 9%NOW is testing a key resistance zone at $804.36-806.76
Break-n-Retest may easily pop to target $884.44-886.81
Stop loss is also a good distance below at $753.37-758.73

Intuition stock: NOW shortI navigate markets by using my dowsing skills, and sometimes, intuitive hits. I actually have to sit still & ask for the intuitive stocks, however, & I don't often do it - even though I've had some remarkable results.
I did take a shot this morning though & heard or received, "NOW". Unsure if it was

ServiceNow Surges 15%+ on Strong Earnings and Analyst UpgradesServiceNow (NYSE: NOW) soared 15.2% to $934.16 by late morning Thursday after releasing strong Q1 2025 results. At the same time, the S&P 500 gained 1.2% and the Nasdaq Composite rose 1.7%. The company posted adjusted earnings per share of $4.04, outperforming analysts’ forecast of $3.83. Revenue ca

Bullish momentum in $NOW! 22% Upside🔥 Bullish momentum in $NOW!
🚀 $1,126 on the horizon! 🎯
✅ Indicators curling upward
✅ Volume shelf ready to launch
✅ Wr% swinging green to red
✅ Great earning/ guidance
Big move loading—are you in? 👀
Not financial advice

NOW is back NOW bullish reversal is about to be confirmed
once it passes the 200 EMA support and close above 948 that will confirm its reversal..
Entry @ 948 ( after close a day candle above 948)
Stop loss @ 890 ( the gap up opening gap)
NOW. Going down to $500. Huge long opportunity!NOW has been super bearish. See my last chart. I will be buying at $500 for a long-term hold. Im really hoping we get down to $500 for my entry.

See all ideas
Summarizing what the indicators are suggesting.
Neutral
SellBuy
Strong sellStrong buy
Strong sellSellNeutralBuyStrong buy
Neutral
SellBuy
Strong sellStrong buy
Strong sellSellNeutralBuyStrong buy
Neutral
SellBuy
Strong sellStrong buy
Strong sellSellNeutralBuyStrong buy
An aggregate view of professional's ratings.
Neutral
SellBuy
Strong sellStrong buy
Strong sellSellNeutralBuyStrong buy
Neutral
SellBuy
Strong sellStrong buy
Strong sellSellNeutralBuyStrong buy
Neutral
SellBuy
Strong sellStrong buy
Strong sellSellNeutralBuyStrong buy
Displays a symbol's price movements over previous years to identify recurring trends.
Curated watchlists where 0L5N is featured.

Frequently Asked Questions
The current price of 0L5N is 970 USD — it has decreased by −2.13% in the past 24 hours. Watch SERVICENOW INC COM USD0.001 stock price performance more closely on the chart.
Depending on the exchange, the stock ticker may vary. For instance, on LSE exchange SERVICENOW INC COM USD0.001 stocks are traded under the ticker 0L5N.
0L5N stock has risen by 1.54% compared to the previous week, the month change is a −2.74% fall, over the last year SERVICENOW INC COM USD0.001 has showed a 24.01% increase.
We've gathered analysts' opinions on SERVICENOW INC COM USD0.001 future price: according to them, 0L5N price has a max estimate of 1,300.00 USD and a min estimate of 734.00 USD. Watch 0L5N chart and read a more detailed SERVICENOW INC COM USD0.001 stock forecast: see what analysts think of SERVICENOW INC COM USD0.001 and suggest that you do with its stocks.
0L5N reached its all-time high on Jan 28, 2025 with the price of 1,198 USD, and its all-time low was 140 USD and was reached on Feb 9, 2018. View more price dynamics on 0L5N chart.
See other stocks reaching their highest and lowest prices.
See other stocks reaching their highest and lowest prices.
0L5N stock is 3.87% volatile and has beta coefficient of 1.48. Track SERVICENOW INC COM USD0.001 stock price on the chart and check out the list of the most volatile stocks — is SERVICENOW INC COM USD0.001 there?
Today SERVICENOW INC COM USD0.001 has the market capitalization of 201.51 B, it has decreased by −0.12% over the last week.
Yes, you can track SERVICENOW INC COM USD0.001 financials in yearly and quarterly reports right on TradingView.
SERVICENOW INC COM USD0.001 is going to release the next earnings report on Oct 22, 2025. Keep track of upcoming events with our Earnings Calendar.
0L5N earnings for the last quarter are 4.09 USD per share, whereas the estimation was 3.57 USD resulting in a 14.71% surprise. The estimated earnings for the next quarter are 4.27 USD per share. See more details about SERVICENOW INC COM USD0.001 earnings.
SERVICENOW INC COM USD0.001 revenue for the last quarter amounts to 3.21 B USD, despite the estimated figure of 3.12 B USD. In the next quarter, revenue is expected to reach 3.35 B USD.
0L5N net income for the last quarter is 385.00 M USD, while the quarter before that showed 460.00 M USD of net income which accounts for −16.30% change. Track more SERVICENOW INC COM USD0.001 financial stats to get the full picture.
No, 0L5N doesn't pay any dividends to its shareholders. But don't worry, we've prepared a list of high-dividend stocks for you.
As of Jul 27, 2025, the company has 26.29 K employees. See our rating of the largest employees — is SERVICENOW INC COM USD0.001 on this list?
EBITDA measures a company's operating performance, its growth signifies an improvement in the efficiency of a company. SERVICENOW INC COM USD0.001 EBITDA is 2.15 B USD, and current EBITDA margin is 16.65%. See more stats in SERVICENOW INC COM USD0.001 financial statements.
Like other stocks, 0L5N shares are traded on stock exchanges, e.g. Nasdaq, Nyse, Euronext, and the easiest way to buy them is through an online stock broker. To do this, you need to open an account and follow a broker's procedures, then start trading. You can trade SERVICENOW INC COM USD0.001 stock right from TradingView charts — choose your broker and connect to your account.
Investing in stocks requires a comprehensive research: you should carefully study all the available data, e.g. company's financials, related news, and its technical analysis. So SERVICENOW INC COM USD0.001 technincal analysis shows the sell today, and its 1 week rating is buy. Since market conditions are prone to changes, it's worth looking a bit further into the future — according to the 1 month rating SERVICENOW INC COM USD0.001 stock shows the buy signal. See more of SERVICENOW INC COM USD0.001 technicals for a more comprehensive analysis.
If you're still not sure, try looking for inspiration in our curated watchlists.
If you're still not sure, try looking for inspiration in our curated watchlists.