Went short on this todayTook a short, its risky given the infra bill bullishness but the chart wasn't supporting a bull count. I guess we will see that in few days :)
0L7S trade ideas
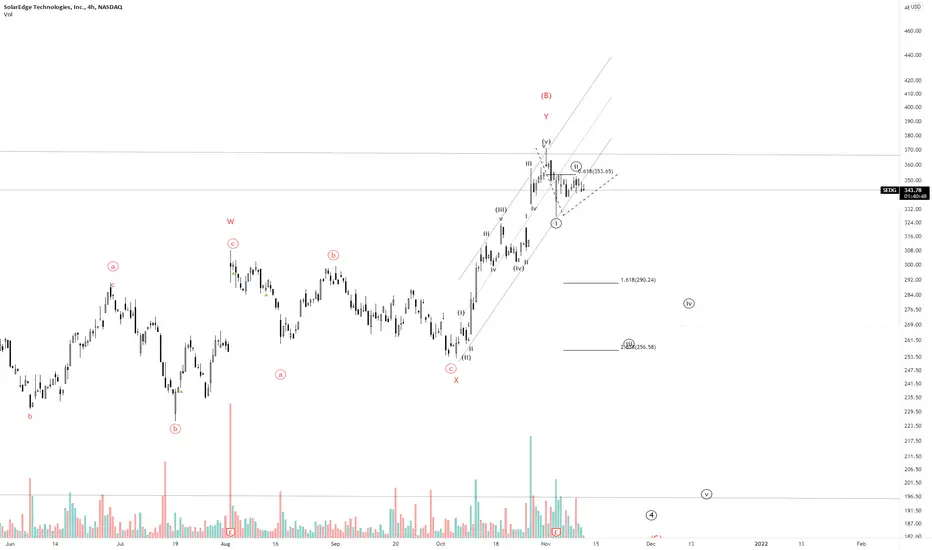
Change in direction/countI have been posting about SEDG since it was $260 and this week i closed all my positions at $370. Though my previous charts shows a much higher target for this stock but i think i was missing that the last wave which got us to the current price doesn't really fit well into an impulsive structure. Hence, recounting it is making me believe that this was just one rebound of the overall correction and we have one more leg down coming to make it a 3-3-5 ( FLAT correction ). Short term i will be bearish on this stock with the Target back to $220 with the SL of $375. I think that's a great RR on this trade.

Bringing this back up againI have posted about this in the past many times and i think its time for this to make a significant move up. Earnings next week for this ticker but based on how ENPH has done today, expect this to do as well.
Its trading in a range of high resistance and a break above $325 will lead to #350, $375 in short term.
Getting ready for an ATH

SEDGLet's see how this plays out. SEDG could do a third and final zigzag before moving to the upside, or this could be wave 1. Lets see how this plays out. TAN looks poised for a break to the upside.


Update | Inverse H&S- BullishVery bullish on SEDG here along with many others in the sector- while certainly a longer-term play, will be watching for a breakout. ICLN & TAN look ready for a breakout as well (attached below along with previous chart)- some bigger support and resistance levels to watch along with some RSI based supply and demand zones to keep an eye on- Bullish all the way and looking for a breakout here
- Inverse Head and Shoulders formed (Orange Neckline)
- Ascending triangle forming on its yearly chart
- Sitting right on its 100-day EMA with the rest starting to curl upwards
- Bollinger bands are starting to squeeze (not pictured)
- Slight hidden bullish divergence on the RSI accompanied with buyers volume starting to pick up relative to seller volume
PT1- $279.50
PT2- $287.52
PT3- $294.32 + Breakout
ICLN
TAN
Previous Charts


SEDGEntered position at -2 sigma. Bullish on the sector as a whole, TAN appears to have broken through a cradle.

Slide into earnings post infrastructureInfrastructure bill is set to pass or fail on Thursday 9/30. This is a technical analysis into earnings post infrastructure. Current nice trend line - and a pennant forming. We are almost at the end of the pennant and based on previous behavior I have charted what candle patterns could develop post infrastructure and into/out of earnings. The company is fundamentally sound with a good balance sheet, no reason to see this pull back unless it is with sympathy of Fear Uncertainty and Doubt of the current market conditions (debt ceiling and inflation sentiment).


Symmetrical Triangle - (Update)See Previous Charts-
- Buyer volume picking back up, has had nice relative strength compared to others in the sector
- MACD cross
Looks like SEDG has finally bottomed after quite a long, and in my opinion a much-needed pullback. SEDG recently was upgraded by Goldman Sachs, will be looking for long entries as there appears to be a Cup and Handle forming as well, bullish
PT1- 260.77$
PT2- $270+
(Boxes are RSI based Supply/Demand zones)
After consolidating in a long regression trend for quite some time, SEDG is holding within a triangle while forming an inverse head and shoulders, (orange- neckline). SEDG has earnings on 8/3' along with ENPH. Looking for a run-up to ER. Both previous price targets hit, undoubtedly a long-term play should provide multiple good entries. Bullish


Bullish- LongLooks like SEDG has finally bottomed after quite a long, and in my opinion a much-needed pullback. SEDG recently was upgraded by Goldman Sachs, will be looking for long entries as there appears to be a Cup and Handle forming as well, bullish.
PT1- 260.77$
PT2- $270+
(Boxes are RSI based Supply/Demand zones)

Bullish- Long PlayAfter consolidating in a long regression trend for quite some time, SEDG is holding within a triangle while forming an inverse head and shoulders, (orange- neckline). SEDG has earnings on 8/3' along with ENPH. Looking for a run up to ER. Both previous price targets hit (see previous chart), undoubtably a long-term play, should provide multiple good entries. Bullish
PT1- $274.79
PT2- $283.67
PT3- $290+
Looks like SEDG has finally bottomed after quite a long, and in my opinion a much-needed pullback. SEDG recently was upgraded by Goldman Sachs, will be looking for long entries as there appears to be a Cup and Handle forming as well, bullish .
PT1- 260.77$
PT2- $270+
(Boxes are RSI based Supply/Demand zones)

Inverse Head and ShouldersSEDG is trying to break the neckline. Long entry level is a break of the neckline with an uptrend. This am it does appear a candle body is peeping over the neckline. I just looked at price, and it is at 266.04 at this second so is above the neckline. There is not a discernible uptrend yet which is another stipulation for long entry level.
Possible stop under right shoulder. I also see support at the thin green line I drew.
There is a 3 outside up pattern close to the bottom which basically confirms the green engulfing candle by sending another green candle to the upside. This is a 2 candle pattern.
You can measure from the head to the neckline and draw a vertical trendline connecting them, then using the magnet, project that trendline upward from the neckline to get a guesstimate of where this may go. Any pattern can fail.
Previous head and shoulders top pattern, but appears SEDG is recovering. You can measure from the head to the neckline on a head and shoulders pattern and project it downward to get an idea of how far price may fall in the same, but opposite way that you measure an inverse H&S.
SEDG is known to be volatile
No recommendation


An Upward correction on SolarEdge SEDG
SEDG is showing a room from an upside move inside the downward channel after retreating from the lower boundary of it.
Prices could target $260 and $273.25 respectively.

SEDG seems to be entering a trend SEDG breaks through Fractal Chaos upper band, Hurst exponent > 0.5, Stochastic indicates oversold and MACD indicates rise.

Are we in impulse Wave 3 of Wave 5 ?To me it looks like we are heading towards $400. Its supported by many analyst's and currently looks to be in Wave 3 of Wave 5.


SEDG 🌦➡️Pattern recognized:
Running flat
➡️Hypothesis:
Bullish
➡️Inter-market analysis:
➡️Conclusion:
LDC fractal on lower time frame. Buy calls expiration minimum 3 months.
***This does not constitute financial advice.***
If you like what you see why not support us?
👇
