$SNPS double insideNASDAQ:SNPS interesting double inside here.
I will be skipping this due to the multiple red volume bars to the left.
I am willing to be patient waiting for better setups.
0LBP trade ideas

SNPS Entry, Volume, Target, StopEntry: with price above 468.03
Volume: with volume greater than 2.69M
Target: 511 area
Stop: Depending on your risk tolerance; Based on an entry of 453.70, 232.84 gets you 3/1 Reward to Risk Ratio.
This swing trade idea is not trade advice and is strictly based on my ideas and technical analysis. No due diligence or fundamental analysis was performed while evaluating this trade idea. Do not take this trade based on my idea, do not follow anyone blindly, do your own analysis and due diligence. I am not a professional trader.

SNPS Entry, Volume, Target, StopEntry: when price clears 468.03
Volume: with daily volume greater than 2.7M
Target: 511 area
Stop: Depending on your risk tolerance; 453.70 gets you 3/1 Risk/Reward.
This swing trade idea is not trade advice and is strictly based on my ideas and technical analysis. No due diligence or fundamental analysis was performed while evaluating this trade idea. Do not take this trade based on my idea, do not follow anyone blindly, do your own analysis and due diligence. I am not a professional trader.

SNPS - Upward Move / Right Arm of WThis is the bullish move that completes the right side of the larger W pattern
The most recent W is slightly shaped differently with the middle of the W being higher than the left side
This could be a bullish sign plotting a higher high which supports the first argument
Price labels are the middle of both W's

SNPS - A Synopsis for SynopsysTechnical Indicators have begun to finally cool off for this one, but such a dramatic trip to the clouds often warrants a visit back to the tree tops before ascending into outer space... If the 2 month MACD crosses again and holds, then this stock has likely entered one of these 5 wave corrective structures outlined. There is always the potential for higher highs, but I would caution against any aggressive longs in this stock until the techs can reset much lower. Monthly MACD cross is still in effect. GLTA!

$SPNS with a Bearish outlook following its earnings #Stocks The PEAD projected a Bearish outlook for $SPNS after a Negative over reaction following its earnings release placing the stock in drift C with an expected accuracy of 75%.

SNPS US stock Buying SignalSNPS US stock Buying Signal with three TPs, and buying price on trendline support


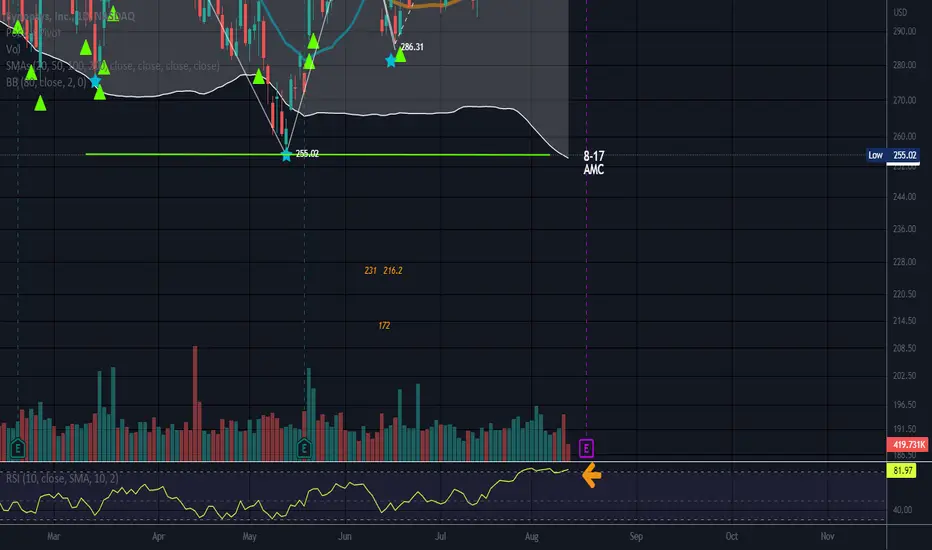
Inverse Head and Shoulders //OverboughtEarnings are 8-17 after market close. Long entry is not usually ideal at overbought levels but we are all different.
SNPS broke the neckline a while back. New ATH 381.70
I suppose the chips bill has energized the semiconductor stocks. On monthly this looks really steep.
This has been overbought for a while with RSI on 80 versus 70. Overbought and oversold conditions can linger for some time, but it does get my attention.
Typical RSI settings are 70 for overbought and 30 for oversold levels.
Price is over the bands set on an 80 DMA which is also an overbought signal.
Overbought is a term used when a security is believed to be trading at a level above its intrinsic or fair value. Overbought generally describes recent or short-term movement in the price of the security, and reflects an expectation that the market will correct the price in the near future.
This will most likely pull back a bit before earnings.
No recommendation
SNPS up
My idea to long Synopsis's, but the best thing that's been written about is how to write fiction, or not to write fiction at all, and not to write for children, not to write for the masses. If you are doing what you love or what you love to do, you can write anything, anywhere and with whom you want. We are the ones who decide what we are interested in and what we can't be interested in. Some choose to write fiction, some don't, that's all.

Can $SNPS continue to lead the tech sector?Notes:
* Very strong up trend on all time frames
* Amazing earnings track record
* Basing for the past ~7 months while the Tech sector and the general market were getting hammered
* Coming off of its 50 day line with higher than average volume
* Coming up on the right side of its base
* Offering a low risk entry
* Showing tonnes of strength and signs of accumulation
* Printed a pocket pivot indicating institutional buying
Technicals:
Sector: Technology - Software - Infrastructure
Relative Strength vs. Sector: 1.48
Relative Strength vs. SP500: 1.42
U/D Ratio: 1.61
Base Depth: 44.77%
Distance from breakout buy point: -14.32%
Volume 20.92% above its 15 day avg.
Trade Idea:
* You can enter now as it's just bouncing off of its 50 day line with higher than average volume
* If you're looking for a better entry you may be able to find one around the $317.73 area
* This stock usually has local tops when the price closes around 12.54% above its 50 EMA
* Consider selling into strength if the price closes 12.34% to 12.74% (or higher) above its 50 EMA
* The last closing price is 5.42% away from its 50 EMA

$SNPS with a Bullish outlook following its earnings #Stocks The PEAD projected a Bullish outlook for $SNPS after a Positive Under reaction following its earnings release placing the stock in drift A with an expected accuracy of 63.64%.

Price is Over Channel/Ws/Sharks, Cyphers & Fib LevelsPrice has broken the top trendline of the channel down.
Many of the stocks have the W pattern in the chart as of late. This one has moved a lot more and much faster than the others with this W that I have been watching.
Valley 2 is lower than valley 1, and the retrace/uptrace leg hit the .382, so when this turned up for the last leg of the W, I then know this could be Cypher or a Shark, and it is a bearish harmonic pattern even though the last leg of the W can be an excellent long.
The Cypher is labeled and measured in a different way than the Shark and is also less common. The Cypher is labeled XABCD and D is calculated using the XC leg or the entire structure and lands close to the .786 of XC. Price has passed the .786 of OX, or the first leg, on it's way up so that is a clue that this is a Shark. The uptrace or second leg of the Cypher should hit the .382 to the .618 range, not much more or much less. So there is a rule for leg 2 which is AB. There is not a rule for the Shark's 2nd leg as long as it does not pass O.
The Shark lands close to the .886 of OX but sometimes hits around the 1.113 of OX. The 1.113 and the .886 are marked. The prior bullish shark (peak 2 is higher than peak1) in this chart hit the 1.113, so it does happen.
If it were to break the right shoulder resistance level, then it is back to the drawing board. Price has touched the .886 on Monday.
The crooked W is called the bearish version of each of these patterns. The crooked M is known as the bullish version, but can feel mighty bearish on the last leg down, just like the bearish version can feel pretty bullish on that last leg up.
The bearish versions have the impulse wave to the downside. To measure crooked Ws, I put the fib table with the 0 at the bottom as I am looking for a level to the upside. For bullish structures or crooked Ms, the 0 goes on top as I am looking for price to pull back on the last leg.
There is also a head and shoulders pattern and SNPS is trying hard to break that right shoulder. Time will tell and unfortunately any pattern, support level, trendline or resistance level can fail.
The Auto-Fib Retracement tool on here is great for nailing a turning point (o:
No recommendation and watching for now. Neutral until price makes a definitive move.
Sorry for the messy chart but I wanted to leave the fib tables on the chart.
If I can't spot the sucker within 30 minutes of sitting down at a table, it could be me )o:

Channel Down SNPS is hitting some hard resistance at the top trend line of the channel down.
Sometimes it is easier to draw trendlines on weekly, then switch back to daily and see where the weekly trendlines you drew line up with price.
The trendlines of the channel down seem to be narrowing a very small amount.
This is also a head and shoulders top which has broken the neckline once and price recovered.
Strong stock in the semiconductor space.
No recommendation.
EPS - Entry/profit target/stop loss (o:

Head and ShouldersPossible stop above neckline.
There is a level of support below the neckline at 275 and may be a more conservative short entry.
Short interest is low at less than 1% and this is a strong stock that I used to own. I am having issues about marking this short )o: so investigate. Earnings 5-18 with forecasts saying this could be an earnings beat. SNPS may not go down without a fight as I have been watching this one struggle for a while now.
The head and shoulders pattern is a predicting chart formation that usually indicates a reversal in the trend where the market makes a shift from bullish to bearish , or vice-versa. There will likely be price differences between the 2 shoulder heights and the pattern formation is rarely perfectly shaped in its appearance.
The “head” is formed when the price increases after the 1st shoulder retraces, creating a high peak above the level of the first shoulder formation. From this point, the price falls and creates the second shoulder, which is usually similar in appearance to the first shoulder.
The head and shoulders pattern does well in a bear market and not so great in a bull market. The Inverse head and shoulders pattern does best in a bull market as I have seen many Inverse H&S fail as of late.
The neckline is often placed at the end of the 1st shoulder. It is usually obvious where the neckline formed as there will often be a struggle at that level to stay above the support of the neckline.
In order to guesstimate how much prices will move after the neckline is broken, you can measure the distance, vertically, from the top of the head to the neckline. This would be a 100% move down from the neckline, but price can fall less or more than this number. Fib levels can be applied to the like with the 0 level placed at the neckline.
The pattern is not valid until there is a clean break of the neckline with a confirmed downtrend.
No recommendation.
Bad news contributed to the 2nd shoulder and it did not surpass the head.

$SNPS with a Bullish outlook following its earnings #Stocks The PEAD projected a Bullish outlook for $SNPS after a Positive over reaction following its earnings release placing the stock in drift B with an expected accuracy of 83.33%.

Synopsys Approves Stock Repurchase Program with Authorization UpSNPS: Synopsys, Inc.
2021-12-10 09:00:00
Synopsys Approves Stock Repurchase Program with Authorization Up to $1 Billion


The power of resultsThe company Synopsys that produces software systems dedicated to the production and testing of ingrate circuits finds new impetus.
The company presented excellent results that have decisively exceeded the estimates of the analysis and thanks to these seems to have started in search of the peak and I doubt it will stop here.
The algorithmic advisor Market Miracle generated an input signal at a price of 272 USD with a target price of 298 USD and a potential profit of 9,4
From the point of view of the fundamental data the price seems to be discounted compared to its fair value and the sustained growth of the company produces exciting expectations for the future.
Analyzing on the graph the price action we see from the indicator Miracle Viewer that the institutional have a net position LONG on the stock and that with good probability this could be increased in the months to come for which the target of 298 USD could be only a starting point
This idea is based on the signal generated by the Marketmiracle advisor whose link you can find by scrolling down this page.


Pull Back Fishing Symmetrical TriangleSNPS pulled way back and appears to be trading in an ABC bullish pattern as well as a symmetrical triangle.
SNPS has broken upper trendline of a symmetrical triangle, but there is also what appears to be a questionable top. This may have corrected enough for the questionable top as it seems we may still be in a bull market. In a bull market, it is not unusual for ugly tops to stop short of a full correction from a top pattern. Just no way to know for sure, but short percent is very low. Negative volume is high.
This lines up with an AB = CD pattern, which is also an ABC bullish pattern and the target is D. The pattern consists of three legs, with two equal legs labelled AB and CD, together they form a zig-zag shape. For this reason it is sometimes called the 'lightning bolt pattern'. It can be used in any financial market and on any time frame. The retracement (from B to C) can be between 38.2% to 78.6% of the A-B leg, however, an ideal pattern has a retracement of 61.8% to 78.6%.
You can take the AB leg using the magnet and extend it from point C to get an idea where price may go.
No recommendation

SNPS - February 18, 2021SNPS good dip buy post earnings. Waiting for the dust to clear as it can come lower but may get a strong bounce off these levels.

Synopsis can help secure the Software Supply ChainBackground
In light of the recent security breaches in the public and private sectors, software security companies have been in focus. Multiple stocks such as Fortinet (FTNT), Qualisys (QLYS) and Crowdstrike (CRWD) have seen an uptick on higher volume over the last few days. The services offered by these companies will certainly help in securing infrastructure and detecting network breaches.
However, it's important to take a look at how the security incident unfolded this past week as the hackers took a unique vector to compromising the servers of so many organizations. They did not attack directly those organizations by penetrating a firewall or using social engineering techniques. Instead the hackers attacked what is known as the Software Supply Chain.
What is the Software Supply Chain? It is the numerous platforms, tools, reusable libraries and processes that software engineers and IT operations use to design, build and deploy software. These include popular open source tools and open source software that have become so popular in the past two decades.
Any company that creates or purchases software for their network goes through a painstaking process to ensure that the software is secure and does not compromise their network. But once vetted, updates to that software, when signed by the vendor with a special digital signature, are typically trusted and deployed without the same deep analysis.
So what happened this past week? Hackers did not target the end customer organizations. In fact, they did not even target the vendor of the software which was compromised. Instead they compromised the tools used to build the software before its digitally signed and delivered to customers. By inserting some undetected code into the build process, the hackers effectively created a trojan horse for their code to enter networks of numerous customers as trusted software.
Solution
There are numerous mitigations and solutions that security experts are looking at to solve this problem. New tools to detect malicious software. AI-based scanning software can detect anomalous traffic in the network. Additional steps before deploying new versions of software that was previously trusted.
The focus in this past weeks event will move to how developers can secure the Software Supply Chain end-to-end. That will include detecting upstream vulnerabilities in 3rd party libraries and tools that are used to create software.
Synopsis
This is where Synopsis has a set of capabilities that may have more demand in the near future. Synopsis offers a leading software integrity platform. It's just one area that they provide services and accounts for about ~10% of their revenues today. They have been carefully building out this area of the business over the past six years by acquiring up to ten different companies with key offerings in software integrity.
Recently, Gartner recognized Synopsis as the leader in End-to-End Application Security. They are the only leader in both the Static Application Security Testing (looking for vulnerabilities in first party code) and Software Composition Analysis (looking for vulnerabilities in 3rd party / open-source code). Synopsis also offers Dynamic Analysis of the final running software as well as professional services to help customers build secure software.
The other areas of Synopsis business is Electronic Design Automation (65% of revenues) and Semiconductor IP (25% of revenues). In these businesses, Synopsis is helping deliver the next generation of high-density chips as well as field programable gate arrays (FPGAs) that will drive smaller electronics, software-powered automobiles, and household automation.
With 150 million lines of code in the average vehicle today, securing the Software Supply Chain becomes even more critical and Synopsis seems to be in the perfect position to fulfill that mission.
Fundamentals
Market cap of $39 billion
153 million shares outstanding (150m shares in float)
YoY Sales Growth of 3%, 13%, 20% last three quarters
YoY EPS Growth of 5%, 47%, 27% last three quarters
Fund ownership of 59%
Announced on 12/16 an accelerated stock buy-back program
Technicals
115% gain from March lows
Currently in seven-day run (higher highs, higher lows)
Broke above buy point of 246.49 on 12/15, still within 5%
Support at ~245, ~234 and ~223
Buy Point
Buy Point: 255.82
10d ATR Stop (x2.7): 240.06 (6.16.%)
Position Size: R16.22
