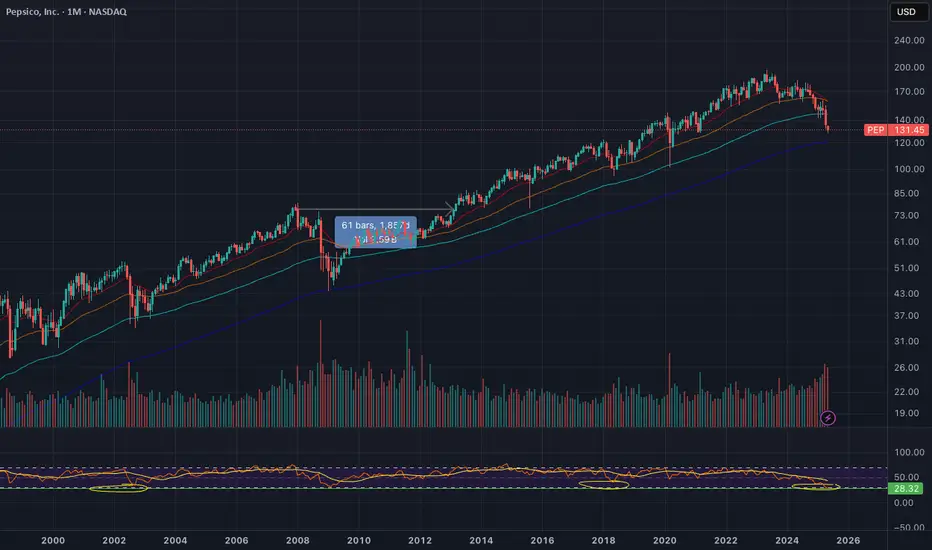
PEP – Bullish Divergence at Weekly DemandPepsiCo (PEP) has retraced into a key weekly demand zone, where price previously launched long bullish legs. At the same time, a bullish divergence is forming between price and RSI, suggesting selling momentum may be weakening.
Structure has clearly shifted bearish over the past two years, with mul
Next report date
—
Report period
—
EPS estimate
—
Revenue estimate
—
6.8 USD
9.58 B USD
91.85 B USD
1.37 B
About PepsiCo, Inc.
Sector
Industry
CEO
Ramon Luis Laguarta
Website
Headquarters
Purchase
Founded
1965
FIGI
BBG00K9Q62D3
PepsiCo, Inc. engages in the manufacture, marketing, distribution, and sale of beverages, food, and snacks. It operates through the following business segments: Frito-Lay North America (FLNA), Quaker Foods North America (QFNA), PepsiCo Beverages North America (PBNA), Latin America (LatAm), Europe, Africa, Middle East, and South Asia (AMESA), and Asia Pacific, Australia and New Zealand, and China Region (APAC). The FLNA segment consists of branded convenient food businesses in the United States and Canada. The QFNA segment includes cereals, rice, and pasta under the Quaker, Pearl Milling Company, Quaker Chewy, Cap'n Crunch, Life, and Rice-A-Roni brands. The PBNA segment is composed of beverage concentrates, fountain syrups, and finished goods under various beverage brands such as Pepsi, Gatorade, Mountain Dew, Diet Pepsi, Aquafina, Diet Mountain Dew, Sierra Mist, and Mug. The LatAm segment covers beverage, food, and snack businesses in the Latin American region. The Europe segment offers beverage, food, and snack goods in Europe and Sub-Saharan Africa regions. The AMESA segment deals with all beverage and convenient food businesses in Africa, the Middle East, and South Asia. The APAC segment refers to all business operations in the Asia Pacific, Australia and New Zealand, and China region. The company was founded by Donald M. Kendall, Sr. and Herman W. Lay in 1965 and is headquartered in Purchase, NY.

PepsiCo (PEP): At a Critical Long-Term Technical JuncturePepsiCo (PEP): At a Critical Long-Term Technical Juncture - Is the Dip an Opportunity?
Looking at PepsiCo's (PEP) monthly chart, I observe a remarkably strong and consistent uptrend spanning over 15 years, clearly defined by a robust long-term trendline (light blue diagonal line). This trendline ha

PEP: Long Buy OpportunityPEP is about to touch the 200 Monthly Moving Average. This last 2009.
The RSI is touching less than 30, which last happened in 1973.
PEP is a Dividend King which has increased it's dividend for 53 years. Did Warren Buffett say compounding is the 8th wonder of the world? Oh no, it was Einstein.
PepsiCo: In the Target ZonePepsiCo is currently trading in the middle of our active Long Target Zone (coordinates: $133.53 – $125.10). Although all technical requirements for the correction of wave a in beige have already been met here, we still see some remaining downward potential for the subordinate wave 5 in turquoise wit

Great RR trade PEP has been sold off so much, it's down to a huge level daily bullish divergence on the RSI, squeeze is reset, MACD is tight and curling up, bands are tight, it either bounces or gets cooked. My PT is $140 and will be playing June 20 140C. Super excited for this trade, played it back in Feb when it

PEPSICO 2nd try...First of all I have to say my first thesis was wrong , even though I mentioned Pepsi as a great countercyclical opportunity to usual stocks , it still got sold off together with the whole market. Not only did it make a retracement , it did a full historical retracement in that time , which gives now

Quick View: $PEP(hourly) Consolidation with Bullish Crossover after a drop of 15%
(weekly), still bearish.
This is a very early signal
Watching $133 as key resistance.
Support → $130/$126

PEP - L1 Bullish Weekly Exhaustion SignalNASDAQ:PEP has triggered a level 1 bullish exhaustion signal on the weekly. This signal has triggered 20 times in the stock's history with a 90% win rate and avg move of 8.2% over the following 10 candles.

One Last Chance This is the last chance for Pepsi to bounce on the monthly trendline before I completely close my position on it. It has been getting destroyed for way too long...

PEPSI BUY ZONE!!We have now reached the optimal buy level for Pepsi with good long term projection. Buy this stock and forget.
Our Target will be the previous all-time-high with the high likely good of continuing beyond.

See all ideas
Summarizing what the indicators are suggesting.
Neutral
SellBuy
Strong sellStrong buy
Strong sellSellNeutralBuyStrong buy
Neutral
SellBuy
Strong sellStrong buy
Strong sellSellNeutralBuyStrong buy
Neutral
SellBuy
Strong sellStrong buy
Strong sellSellNeutralBuyStrong buy
An aggregate view of professional's ratings.
Neutral
SellBuy
Strong sellStrong buy
Strong sellSellNeutralBuyStrong buy
Neutral
SellBuy
Strong sellStrong buy
Strong sellSellNeutralBuyStrong buy
Neutral
SellBuy
Strong sellStrong buy
Strong sellSellNeutralBuyStrong buy
Displays a symbol's price movements over previous years to identify recurring trends.
US713448FG8
PEPSICO 21/51Yield to maturity
6.81%
Maturity date
Oct 21, 2051
PEP4864210
PepsiCo, Inc. 3.375% 29-JUL-2049Yield to maturity
6.59%
Maturity date
Jul 29, 2049
US713448FF0
PEPSICO 21/41Yield to maturity
6.46%
Maturity date
Oct 21, 2041
US713448DP0
PEPSICO INC. 16/46Yield to maturity
6.40%
Maturity date
Oct 6, 2046
PEP4895343
PepsiCo, Inc. 2.875% 15-OCT-2049Yield to maturity
6.38%
Maturity date
Oct 15, 2049
PEP4968015
PepsiCo, Inc. 3.875% 19-MAR-2060Yield to maturity
6.33%
Maturity date
Mar 19, 2060
PEP4968014
PepsiCo, Inc. 3.625% 19-MAR-2050Yield to maturity
6.31%
Maturity date
Mar 19, 2050
PEPS
PEPSICO INC. 17/47Yield to maturity
6.17%
Maturity date
May 2, 2047
PEP5447005
PepsiCo, Inc. 4.2% 18-JUL-2052Yield to maturity
6.17%
Maturity date
Jul 18, 2052
PEP3887895
PepsiCo, Inc. 3.6% 13-AUG-2042Yield to maturity
6.10%
Maturity date
Aug 13, 2042
PEPB
PEPSICO INC. 12/42Yield to maturity
6.02%
Maturity date
Mar 5, 2042
See all 0QOS bonds
Curated watchlists where 0QOS is featured.


Related stocks
Frequently Asked Questions
The current price of 0QOS is 131.6 USD — it has decreased by −1.23% in the past 24 hours. Watch PEPSICO INC CAP USD0.016666 stock price performance more closely on the chart.
Depending on the exchange, the stock ticker may vary. For instance, on LSE exchange PEPSICO INC CAP USD0.016666 stocks are traded under the ticker 0QOS.
0QOS stock has fallen by −1.19% compared to the previous week, the month change is a −3.01% fall, over the last year PEPSICO INC CAP USD0.016666 has showed a −2.03% decrease.
We've gathered analysts' opinions on PEPSICO INC CAP USD0.016666 future price: according to them, 0QOS price has a max estimate of 169.00 USD and a min estimate of 110.00 USD. Watch 0QOS chart and read a more detailed PEPSICO INC CAP USD0.016666 stock forecast: see what analysts think of PEPSICO INC CAP USD0.016666 and suggest that you do with its stocks.
0QOS reached its all-time high on Sep 3, 2019 with the price of 134.4 USD, and its all-time low was 99.6 USD and was reached on Apr 25, 2018. View more price dynamics on 0QOS chart.
See other stocks reaching their highest and lowest prices.
See other stocks reaching their highest and lowest prices.
0QOS stock is 2.18% volatile and has beta coefficient of 0.02. Track PEPSICO INC CAP USD0.016666 stock price on the chart and check out the list of the most volatile stocks — is PEPSICO INC CAP USD0.016666 there?
Today PEPSICO INC CAP USD0.016666 has the market capitalization of 181.39 B, it has increased by 0.06% over the last week.
Yes, you can track PEPSICO INC CAP USD0.016666 financials in yearly and quarterly reports right on TradingView.
PEPSICO INC CAP USD0.016666 is going to release the next earnings report on Jul 17, 2025. Keep track of upcoming events with our Earnings Calendar.
0QOS earnings for the last quarter are 1.48 USD per share, whereas the estimation was 1.49 USD resulting in a −0.51% surprise. The estimated earnings for the next quarter are 2.03 USD per share. See more details about PEPSICO INC CAP USD0.016666 earnings.
PEPSICO INC CAP USD0.016666 revenue for the last quarter amounts to 17.92 B USD, despite the estimated figure of 17.76 B USD. In the next quarter, revenue is expected to reach 22.26 B USD.
0QOS net income for the last quarter is 1.83 B USD, while the quarter before that showed 1.52 B USD of net income which accounts for 20.42% change. Track more PEPSICO INC CAP USD0.016666 financial stats to get the full picture.
Yes, 0QOS dividends are paid quarterly. The last dividend per share was 1.42 USD. As of today, Dividend Yield (TTM)% is 4.10%. Tracking PEPSICO INC CAP USD0.016666 dividends might help you take more informed decisions.
PEPSICO INC CAP USD0.016666 dividend yield was 3.51% in 2024, and payout ratio reached 76.68%. The year before the numbers were 2.91% and 75.37% correspondingly. See high-dividend stocks and find more opportunities for your portfolio.
As of Jun 14, 2025, the company has 319 K employees. See our rating of the largest employees — is PEPSICO INC CAP USD0.016666 on this list?
EBITDA measures a company's operating performance, its growth signifies an improvement in the efficiency of a company. PEPSICO INC CAP USD0.016666 EBITDA is 18.01 B USD, and current EBITDA margin is 19.72%. See more stats in PEPSICO INC CAP USD0.016666 financial statements.
Like other stocks, 0QOS shares are traded on stock exchanges, e.g. Nasdaq, Nyse, Euronext, and the easiest way to buy them is through an online stock broker. To do this, you need to open an account and follow a broker's procedures, then start trading. You can trade PEPSICO INC CAP USD0.016666 stock right from TradingView charts — choose your broker and connect to your account.