3 Reasons Why Cisco Stock Is Ready to Rocket (Bonus Strategy)3 Reasons Why Cisco Stock Is Ready to Rocket (Bonus Strategy Inside)
Cisco is flashing bullish signs from candlesticks to volume. Here's why a breakout could be imminent — with a bonus momentum strategy revealed.
---
Cisco Systems ( NASDAQ:CSCO ) is showing signs of a potential breakout — and sav
Next report date
—
Report period
—
EPS estimate
—
Revenue estimate
—
2.5 USD
10.32 B USD
53.80 B USD
3.95 B
About Cisco Systems, Inc.
Sector
Industry
CEO
Charles H. Robbins
Website
Headquarters
San Jose
Founded
1984
FIGI
BBG00QDG6DB5
Cisco Systems, Inc. engages in the design, manufacture, and sale of Internet Protocol-based networking products and services related to the communications and information technology industry. The firm operates through the following geographical segments: the Americas, EMEA, and APJC. Its products include the following categories: Secure, Agile Networks, Internet for the Future, Collaboration, End-to-End Security, Optimized Application Experiences, and Other Products. The company was founded by Sandra Lerner and Leonard Bosack in 1984 and is headquartered in San Jose, CA.
Related stocks

CSCO eyes on $59.22: Key resistance to Tariff Recovery waveThis "internet oldie" usually lags the newcomers.
The key will be to break the Covid fib at $59.22
If we get a dip then look to the sister fib at $57.81

CSCO Long CallsCisco's uptrend exceeded previous highs and heading toward 127% extension from the 4/9 Tariff lows.
Prices are currently consolidating between $68 and $70 with a volume level.
I am buying in the lower 1/2 - 1/4 of the range with an expectation of a move back to the $70 level and beyond.
August 15

CSCOThe CSCO stock is very promising for investors, with excellent indicators. It has formed a symmetrical triangle on the weekly chart, which has been strongly broken out of after a significant accumulation phase at $55.95. Currently, we are at a resistance zone where we expect a correction. There are

Cybersecurity Strength Makes It a Stable Long-Term Bet Targets:
- T1 = $68.31
- T2 = $72.05
Stop Levels:
- S1 = $64.34
- S2 = $59.69
**Wisdom of Professional Traders:**
This analysis synthesizes insights from thousands of professional traders and market experts, leveraging collective intelligence to identify high-probability trade setups

Cisco Is Pushing a Generational HighCisco Systems has climbed as AI investment helps power growth, and some traders may think the move will continue.
The first pattern on today’s chart is the February 13 peak of $66.50. It was the highest level since September 2000, when the dotcom bubble was deflating. The networking giant come with

What Fuels Cisco's Quiet AI Domination?Cisco Systems, a long-standing titan in networking infrastructure, is experiencing a significant resurgence, largely driven by a pragmatic and highly effective approach to artificial intelligence. Unlike many enterprises chasing broad AI initiatives, Cisco focuses on solving "boring" yet critical cu

Cisco’s Charts Are Painting a Conflicting PictureCisco Systems NASDAQ:CSCO lost some ground in recent days even as the tech giant kicked off its Cisco Live 2025 event this week in San Diego, and the stock’s charts are flashing some conflicting signals. Let’s take a look.
Cisco’s Fundamental Analysis
CSCO’s three-day Cisco Live event began Mo

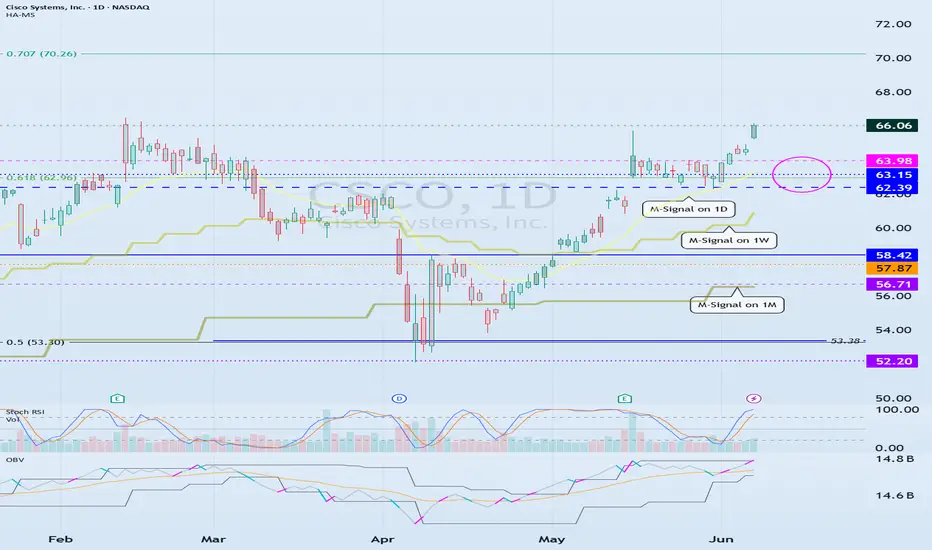
Cisco Wave Analysis – 11 June 2025
- Cisco reversed from the key resistance level 65.60
- Likely to fall to support level 62.20
Cisco recently reversed down from the key resistance level 65.60 (which has been reversing the price from the start of February).
The downward reversal from the resistance level 65.60 created the daily J

Need to see if price can hold above 62.39-63.98
Hello traders.
If you "Follow", you can always get the latest information quickly.
Have a nice day today.
-------------------------------------
(CSCO 12M chart)
The most important area on the CSCO chart is around 42.85.
Therefore, if it falls to around 42.85 and shows support, you should check
See all ideas
Summarizing what the indicators are suggesting.
Neutral
SellBuy
Strong sellStrong buy
Strong sellSellNeutralBuyStrong buy
Neutral
SellBuy
Strong sellStrong buy
Strong sellSellNeutralBuyStrong buy
Neutral
SellBuy
Strong sellStrong buy
Strong sellSellNeutralBuyStrong buy
An aggregate view of professional's ratings.
Neutral
SellBuy
Strong sellStrong buy
Strong sellSellNeutralBuyStrong buy
Neutral
SellBuy
Strong sellStrong buy
Strong sellSellNeutralBuyStrong buy
Neutral
SellBuy
Strong sellStrong buy
Strong sellSellNeutralBuyStrong buy
Displays a symbol's price movements over previous years to identify recurring trends.
Curated watchlists where 0R0K is featured.


Frequently Asked Questions
The current price of 0R0K is 68.6 USD — it has increased by 0.79% in the past 24 hours. Watch CISCO SYSTEMS INC COM USD0.001 stock price performance more closely on the chart.
Depending on the exchange, the stock ticker may vary. For instance, on LSE exchange CISCO SYSTEMS INC COM USD0.001 stocks are traded under the ticker 0R0K.
0R0K stock has risen by 0.11% compared to the previous week, the month change is a 0.95% rise, over the last year CISCO SYSTEMS INC COM USD0.001 has showed a 40.56% increase.
We've gathered analysts' opinions on CISCO SYSTEMS INC COM USD0.001 future price: according to them, 0R0K price has a max estimate of 78.00 USD and a min estimate of 64.00 USD. Watch 0R0K chart and read a more detailed CISCO SYSTEMS INC COM USD0.001 stock forecast: see what analysts think of CISCO SYSTEMS INC COM USD0.001 and suggest that you do with its stocks.
0R0K reached its all-time high on Jul 1, 2025 with the price of 69.7 USD, and its all-time low was 38.8 USD and was reached on Feb 9, 2018. View more price dynamics on 0R0K chart.
See other stocks reaching their highest and lowest prices.
See other stocks reaching their highest and lowest prices.
0R0K stock is 0.92% volatile and has beta coefficient of 1.04. Track CISCO SYSTEMS INC COM USD0.001 stock price on the chart and check out the list of the most volatile stocks — is CISCO SYSTEMS INC COM USD0.001 there?
Today CISCO SYSTEMS INC COM USD0.001 has the market capitalization of 270.43 B, it has increased by 0.52% over the last week.
Yes, you can track CISCO SYSTEMS INC COM USD0.001 financials in yearly and quarterly reports right on TradingView.
CISCO SYSTEMS INC COM USD0.001 is going to release the next earnings report on Aug 13, 2025. Keep track of upcoming events with our Earnings Calendar.
0R0K earnings for the last quarter are 0.96 USD per share, whereas the estimation was 0.92 USD resulting in a 4.68% surprise. The estimated earnings for the next quarter are 0.98 USD per share. See more details about CISCO SYSTEMS INC COM USD0.001 earnings.
CISCO SYSTEMS INC COM USD0.001 revenue for the last quarter amounts to 14.15 B USD, despite the estimated figure of 14.05 B USD. In the next quarter, revenue is expected to reach 14.62 B USD.
0R0K net income for the last quarter is 2.49 B USD, while the quarter before that showed 2.43 B USD of net income which accounts for 2.59% change. Track more CISCO SYSTEMS INC COM USD0.001 financial stats to get the full picture.
Yes, 0R0K dividends are paid quarterly. The last dividend per share was 0.41 USD. As of today, Dividend Yield (TTM)% is 2.36%. Tracking CISCO SYSTEMS INC COM USD0.001 dividends might help you take more informed decisions.
CISCO SYSTEMS INC COM USD0.001 dividend yield was 3.30% in 2024, and payout ratio reached 62.19%. The year before the numbers were 2.96% and 50.12% correspondingly. See high-dividend stocks and find more opportunities for your portfolio.
As of Jul 25, 2025, the company has 90.4 K employees. See our rating of the largest employees — is CISCO SYSTEMS INC COM USD0.001 on this list?
EBITDA measures a company's operating performance, its growth signifies an improvement in the efficiency of a company. CISCO SYSTEMS INC COM USD0.001 EBITDA is 15.10 B USD, and current EBITDA margin is 28.64%. See more stats in CISCO SYSTEMS INC COM USD0.001 financial statements.
Like other stocks, 0R0K shares are traded on stock exchanges, e.g. Nasdaq, Nyse, Euronext, and the easiest way to buy them is through an online stock broker. To do this, you need to open an account and follow a broker's procedures, then start trading. You can trade CISCO SYSTEMS INC COM USD0.001 stock right from TradingView charts — choose your broker and connect to your account.
Investing in stocks requires a comprehensive research: you should carefully study all the available data, e.g. company's financials, related news, and its technical analysis. So CISCO SYSTEMS INC COM USD0.001 technincal analysis shows the strong buy rating today, and its 1 week rating is buy. Since market conditions are prone to changes, it's worth looking a bit further into the future — according to the 1 month rating CISCO SYSTEMS INC COM USD0.001 stock shows the buy signal. See more of CISCO SYSTEMS INC COM USD0.001 technicals for a more comprehensive analysis.
If you're still not sure, try looking for inspiration in our curated watchlists.
If you're still not sure, try looking for inspiration in our curated watchlists.