REGN – Bullish Engulfing + RSI Divergence at Weekly DemandRegeneron (REGN) is showing strong technical signals of potential reversal from a key weekly demand zone, replicating a setup similar to March 2021.
🔹 Bullish Engulfing Candle forms directly at the demand zone after a multi-month downtrend.
🔹 Volume Spike confirms strong buyer interest.
🔹 RSI shows bullish divergence, breaking its internal structure and holding above 30.
🔹 MACD crossover is setting up, with histogram and signal lines echoing the same configuration from March 2021 — which led to a significant rally.
This is a textbook confluence setup:
Structure (demand zone)
Momentum (RSI divergence)
Confirmation (volume + engulfing)
Trigger alignment (MACD timing)
A decisive follow-through above recent highs could confirm the reversal and initiate a new bullish leg.
0R2M trade ideas

Regeneron Pharmaceutical's MFI implying "Trough in the making"1/ Using just this indicator " Alon" is a very dangerous game like you can blow up your
account !!!
2/Non the less, such readings accompanied by (-86%) or ( 78-%) or (-91%) draw downs
such as on the chart above has resulted in the past, in 3 occasions, in big and historical
bullish moves !!! "Generational buying " Wealth creation type of trading !!!

Regn relative to SPX is getting "First timer" on RSi , B% & MACDRegn Relative to SPX is getting hammered big time !!!
Unless we are about to crash like 1929 = $1, these
readings we are seeing have not been seeing since ever !!!

Regeneron Pharmaceuticals Q2-Q3 Confirmed "Troughing in ProgressIF we do not crash like many Elliottsions are suggesting implying of Grand 5th wave since 1929...
iF we do not start WW3...
IF everything utterly absolute out there in the pharmaceutical industries locally
and globally...
IF our studies of the relation between XLV and Regeneron Pharmaceuticals is
remotely correct...
Then we should have struck a trough or we shall see one in the next few months
Q2-Q4 = We will see a big bullish move next !
*** Risk down is (-35%) ...

REGN reversal playNASDAQ:REGN shows evidence of a price recovery underway as illustrated by momentum indicators and volumn oscillator on the daily. This is further backed up by encouraging signals on both lower and highe timeframes.

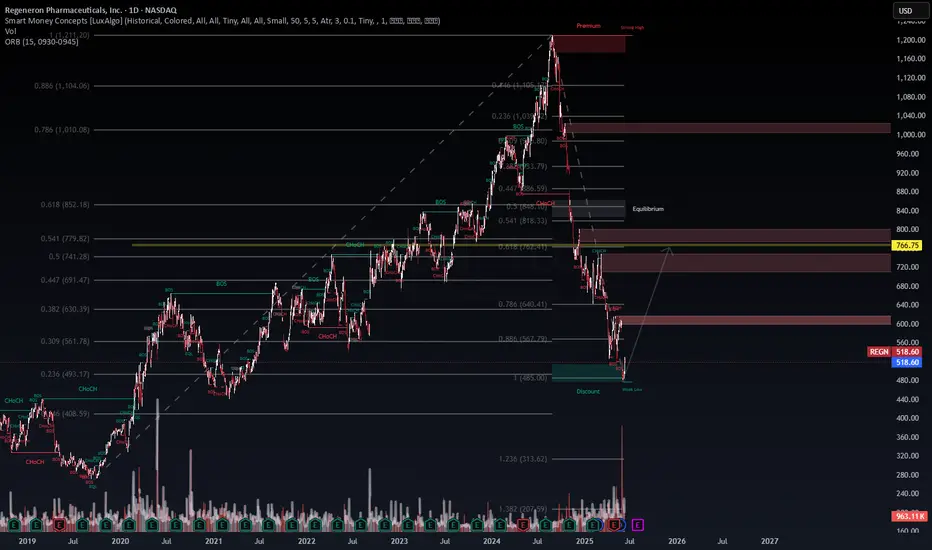
REGN | Regeneron Pharmaceuticals – Macro Reaccumulation SetupPublished by WaverVanir International LLC | 06/12/2025
Regeneron has completed a deep retracement, touching the 0.886 Fibonacci level (~$567) and entering a strong discount zone, coinciding with a weak low sweep and increasing volume — suggesting potential accumulation by institutions.
🔍 Key Confluences:
🔄 Internal CHoCH and BOS structure shift indicates short-term reversal
🔵 Entered macro discount territory with a clean sweep of liquidity below $485
🟡 Targeting major inefficiency and liquidity void around $766.75, aligning with 0.5 retracement and prior equilibrium
🟥 Supply zones between $640–$720 may offer resistance/partial profit-taking zones
📉 Risk Framework:
Entry consideration: $500–$520
Stop loss idea: Below $475 (invalidate weak low sweep)
Primary Target: $766.75
Secondary Target (Extended): $818–$852
🧠 Fundamental & Macro Watch:
Upcoming trial results or FDA action could act as a key catalyst
Biotech sector sentiment tied to macro healthcare policy and AI-integration for drug discovery
Recent earnings showed strong forward guidance – potential re-rating ahead
📈 Probabilistic Outlook:
Bullish retracement toward $766.75: 70%
Extended bearish continuation (below $485): 15%
Sideways chop: 15%
🧭 Smart money often reacts to extreme fear – REGN may be entering a mark-up phase if confirmed with institutional follow-through.
#REGN NASDAQ:REGN #SmartMoneyConcepts #FibConfluence #WaverVanir #BiotechStocks #SwingTrading #TechnicalAnalysis #InstitutionalOrderFlow
REGN - Investment …We have the weekly and monthly MACDs reset in the basement and we have reached my blue long term trend line at the bottom of the channel. This a real company …sell off has been way overdone.

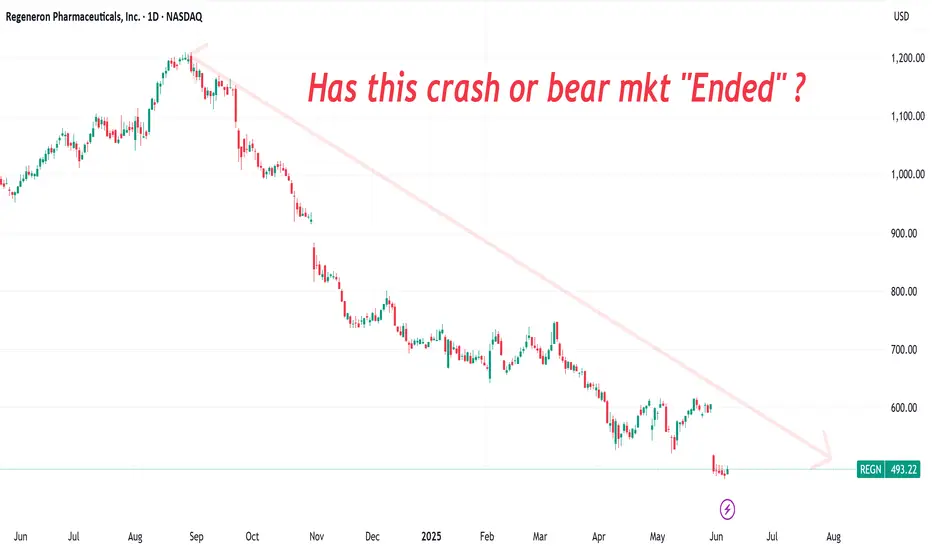
Regn's Bear market is getting close to an "End" or not ?This is 101 crash and bear market together no " Pause" No "Rest" area
one almost straight line going down and hardly you can count the waves !!!
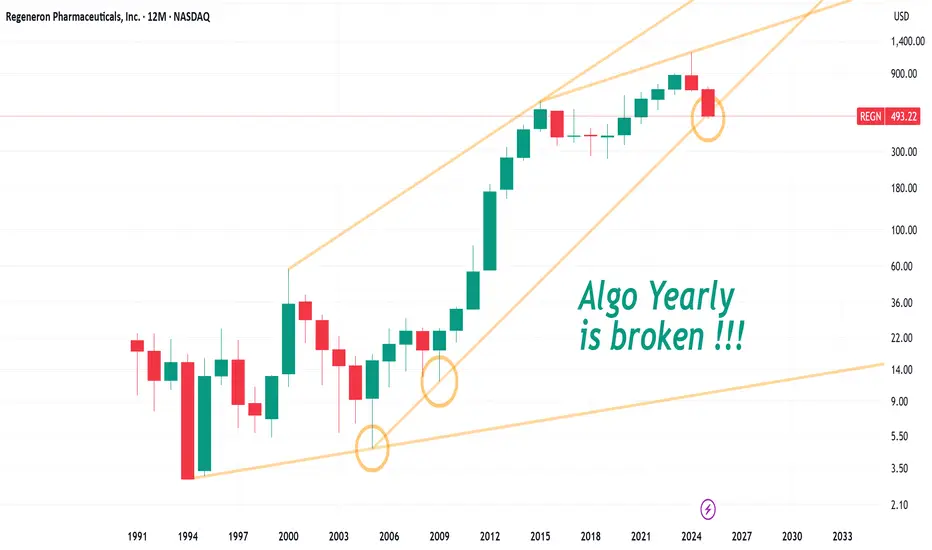
Regn's Yearly Algo chart is broken "Flash Red" unless W bounce 101 Trend analysis nothing fancy here just a line on the algo method of charting
This is a fact not a suggesting of up down movements.
Regn's RSI reading is at it's lowest since IPO Monthly!!45%-500% Moves were followed after registering higher readings all else absolute !!!
Past performance dose not guarantee futures returns but this reading is "One of a kind"
to say the least !!!

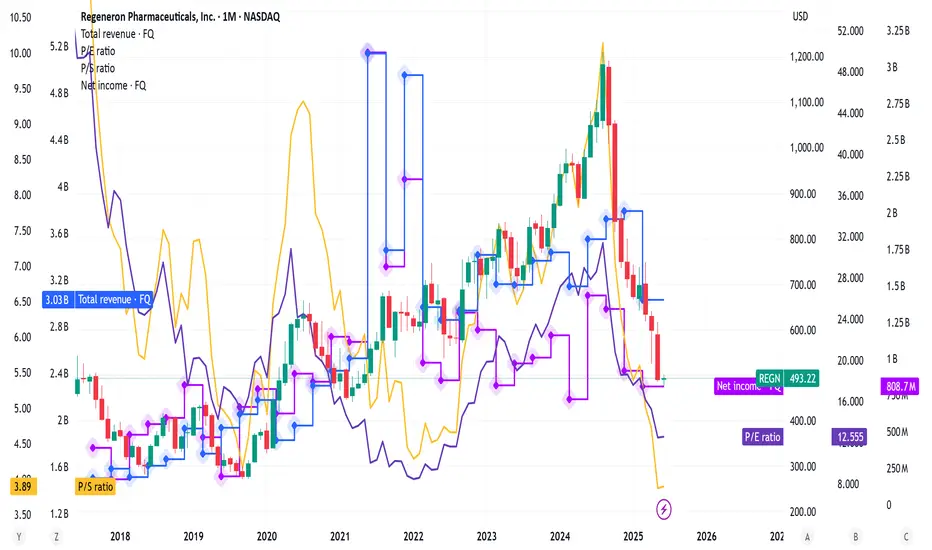
REGN looks & sounds fundamentally good, all else absolute !!!Using 4 Fundamental metrics:
P/S & P/E, net income & total revenues all sounding like a buying opportunity at these levels but structurally this crash style move is something else one of a kind or i am missing something here ( all else absolute !!!)
REGN // The yellow line is our support point. It is best to stop at possible closings below the yellow line.

Regeneron Pharmaceuticals | REGN | Long at $502.28Regeneron Pharmaceuticals NASDAQ:REGN stock dropped more than 17% today due to mixed Phase 3 trial results for itepekimab, a potential COPD drug. However, the company has an extensive drug pipeline, raked in over $14 billion last year, and is currently trading at a price-to-earnings of 15x. Debt-to-equity is 0.09x (extremely healthy) and earnings are forecast to grow 7.5% per year. While 2025 is anticipated to be its "worst" earnings year, the outlook through 2028 looks like steady growth in revenue and cash flow.
From a technical analysis view, the stocks entered my "crash" simple moving average zone today (currently between $466 and $502). More often than not, this area signals a bottom in the near-term, but it's not guaranteed. I wouldn't be surprised if the $450s-$460s get hit before a reversal if the market shifts negatively - which will be another entry for me. If it moves into my "major" crash zone in the $300s to close more gaps on the daily chart, I will be piling into this stock heavily (like I did with NYSE:UNH ) for a longer-term hold - of course, unless fundamentals change. I'm going to keep my target small unless there is a "major crash" and eye the closing of the nearest price gap on the daily. There is another between $883-$914...
Targets:
$590 (+17.5%)

REGN Technical Analysis: Potential Bullish SetupREGN is currently at a strong weekly support level, having formed a double bottom with a clear bullish divergence on the daily chart. The price has also closed above a downward trendline, signaling a potential shift in momentum. While the price might be slightly resistant in the 668 - 686 zone, a strong close above this area could lead to further upside.
Trading Recommendations:
Entry Point (CMP): 594
Stop-Loss: Closing below 520
Take Profit 1: 686
Take Profit 2: Open
Beyond the initial target, other potential targets include 740. After that, the price could look to fill a gap at 914, and potentially even hit 1200 as there appears to be no major resistance before that level.
Happy trading!

REGNan upward trend in the prices of an industry's stocks or the overall rise in broad market indices, characterized by high investor confidence

REGN: Second Attempt at Strong Support with 1/18 Risk/RewardNASDAQ:REGN is displaying a strong historical bullish trend and is currently offering a potential buying opportunity. After a recent pullback , the stock has reached a key support level , providing a favorable entry point. The risk/reward ratio is highly attractive, with a 1/18 potential to the all-time high (ATH) . This is my second attempt after the first stop was triggered. With rising volume over the past month indicating growing accumulation, the setup suggests renewed buying momentum. Now could be the ideal time to buy, aiming for a rebound toward the ATH.

REGN Stock - A Strong Buy OpportunityNASDAQ:REGN is in a historical bullish trend , and right now offers a potential buying opportunity:
Discount at Strong Support : After a pullback, the stock has reached a key support level , providing a good entry point.
Excellent Risk/Reward : With a 1:14 ratio to the all-time high (ATH) , the upside is significant for those willing to risk.
Bullish Signals : Last week showed a strong bullish candle, and the rising volume over the past month suggests growing accumulation, indicating renewed buying momentum .
Now could be an ideal time to buy, targeting a bounce back to the ATH.

The weekly $REGN - oversold and at significant potenial demand The weekly NASDAQ:REGN is at a crucial level that offers a good R/R. Oversold and stretched to the downside could offer a significant bounce from these levels.
Not financial advise!!

NASDAQ-REGN at a Crossroads: Breakdown or Breakout?The Market’s Dilemma: Is REGN Ready for a Reversal?
The biotech giant Regeneron Pharmaceuticals (NASDAQ: REGN) is hovering at a critical juncture. Trading at $672.98, the stock has plummeted 44.4% from its all-time high of $1211.19 just five months ago. With the RSI at 38.8, the market is edging toward oversold conditions—but does that mean a bounce is imminent, or is further downside in store?
Recent sell volume spikes and bearish VSA patterns suggest institutional distribution, while key support at $669.24 is under pressure. If buyers fail to hold this level, the next move could be decisive. Meanwhile, resistance looms at $693.67, creating a tight battlefield between bulls and bears.
With momentum indicators flashing caution and a looming test of critical levels, traders must ask: Is REGN poised for a short-term rally, or are we witnessing the start of an extended breakdown? Stay sharp—this might be the last chance to act before the next major move.
NASDAQ-REGN Roadmap: A Pattern-Driven Journey
The price action on Regeneron Pharmaceuticals (NASDAQ: REGN) has been painting a vivid picture of institutional maneuvering. By analyzing the sequential Volume Spread Analysis (VSA) and buy/sell volume patterns, we can uncover the footprints of smart money and determine where the next big move might emerge. Let’s break it down step by step.
January 22: The Battle Between Bulls and Bears
A VSA Buy Pattern Extra 1st appeared, signaling a potential reversal after prolonged selling. The open was at $682.89, but the close dipped to $679.24, showing hesitation. However, a competing Sell Volumes Max pattern on the same day added to the confusion. The key takeaway? The market was indecisive, but the tug-of-war suggested a major breakout was brewing.
January 23: Buyers Step Up
A surge in buy volumes confirmed the bullish bias. With an open at $692.165 and a close at $694.36, bulls showed their dominance. This validated the previous buy setup and confirmed that institutions were stepping in.
January 24: A Bullish Fake-Out?
The VSA Manipulation Buy Pattern 3rd hinted at continued strength. The market opened at $680.78 and closed higher at $683.75, pushing past short-term resistance. However, the presence of a Buy Volumes Takeover pattern earlier in the day, which was immediately sold off, hinted at hidden distribution. The market was climbing, but the undercurrent wasn’t as strong as it seemed.
January 27-31: Sellers Take Control
A clear shift in sentiment emerged as Sell Volumes Max patterns took over. On January 27, the market opened at $685.17 but barely moved, closing at $684.67—a sign of exhaustion. Then, on January 30-31, massive sell volumes hit, confirming distribution. The price tumbled from $684.17 to $676.50, sealing the bearish outlook.
Key Takeaway: Where Do We Go From Here?
The January 23-24 bullish patterns initially suggested an upside continuation, but the surge in selling pressure from January 27 onward negated that move. The market failed to hold its ground, confirming the strength of the selling signals. With support at $669.24 under fire, the next key zone to watch is $652-655. If bulls don’t reclaim momentum soon, REGN could be setting up for a deeper correction. Stay sharp—the next move is brewing.
Technical & Price Action Analysis: Key Levels in Play
The market structure on NASDAQ-REGN is shifting, and traders need to keep an eye on these critical levels. If support zones fail to hold, they flip into resistance—trapping late buyers and fueling further downside moves. Likewise, if resistance levels break, they become new bases for continuation plays.
Support Levels:
669.24 – The immediate support zone; losing this level could open the floodgates for deeper selling.
592.7 – A major downside target if sellers gain full control. This level previously acted as a demand zone.
547.57 – The last stand for bulls before things get ugly. Below here, expect a momentum flush.
Resistance Levels:
693.67 – The first wall bulls need to break for any short-term recovery. A failure here keeps the bears in charge.
707.835 – A psychological pivot; clearing this would suggest a trend shift.
752.54 – Major battle zone. If reached, expect serious profit-taking.
784.1 – Key breakout threshold; breaking and holding above opens the door for a bigger upside run.
810.53 – The big league level. Any rally stalling here signals trend exhaustion.
Powerful Support Levels:
945.71 – Long-term structure zone. If the price ever reclaims this level, bulls are fully back in control.
985.9 – The pivot point for a full-blown trend reversal.
1175.16 – The holy grail for long-term investors; reclaiming this would signal a multi-month rally.
Powerful Resistance Levels:
575.46 – A historical battleground; failure to hold here sends a strong bearish signal.
549.69 – A make-or-break level for dip buyers. If sellers push below, expect panic exits.
The playbook is simple: react, don’t predict. Watch for confirmations, volume shifts, and price reactions at these levels. No clean break? No trade. The market always shows its hand—just follow the footprint.
Trading Strategies Using Rays: Precision in Action
The "Rays from the Beginning of Movement" concept is built on dynamic Fibonacci-based levels that adapt to market conditions. Unlike traditional support and resistance levels, these rays adjust automatically as price action evolves, providing a leading rather than lagging perspective. The goal is not to predict exact levels but to identify high-probability zones where price interactions signal trend continuation or reversal.
These rays interact with VSA dynamics and moving averages, making them powerful confirmation tools. The price will move from ray to ray, establishing first, second, and third trade targets accordingly. Entries should be made only after interaction with the ray and confirmation of direction.
Optimistic Scenario: Bullish Ray Interaction
Entry near 669.24 (support level + interaction with a rising ray)
First target: 693.67 (resistance level aligned with MA50)
Second target: 707.83 (breakout level with confirmation from VSA)
Third target: 752.54 (major resistance, completion of the wave)
💡 If momentum is strong, price could extend toward 784.1, aligning with long-term trend acceleration.
Pessimistic Scenario: Bearish Ray Interaction
Entry after breakdown of 669.24 (failure to hold as support flips to resistance)
First target: 592.7 (next structural level, confirming bearish intent)
Second target: 547.57 (full breakdown level, aligning with MA200 interaction)
Third target: 575.46 (major psychological barrier—either reversal or trend continuation)
💡 If the bearish wave extends, price may push toward 549.69, signaling further downside.
Potential Trades Based on Ray Interaction
Buy from 669.24 → Target 693.67 – Confirmation required via VSA buy volumes.
Breakout above 693.67 → Target 707.83 – Only valid if price holds above MA50.
Sell below 669.24 → Target 592.7 – Valid only after a strong bearish volume surge.
Rejection at 707.83 → Short to 669.24 – Reversal signal from VSA sell zones.
Your Turn: Let’s Trade Smart Together! 🚀
If this analysis makes sense to you, hit that Boost and save this idea—because the key to trading is understanding the levels where trades can be executed. Follow how the price moves and compare it to my setup. The market always speaks to those who listen.
Got questions? Drop them in the comments! Let’s break things down together. If you need an analysis of another asset, let me know—we can figure out the best way to do it. Some I can share for free, while for private setups, we can discuss the details.
My strategy automatically plots all rays and levels, but the indicator is available only in Private. If you want to trade using this system, send me a direct message.
These rays work on all assets, and price moves like clockwork along them. If you want me to chart your asset, hit Boost and comment below. The more interest, the higher the chance I’ll cover your instrument next!
Follow me here on TradingView—no fluff, no hype, just **clear levels and market logic.**🔥

$REGN LongThis is just my observation, but not an advice.
Technical:
REGN touched its two strong trendline since 2020 and 2021.
REGN reached the 50% correction since 2020.
REGN is oversold daily and weekly.
A significant divergence is observable on daily chart.
Price touched SMA 200.
Fundamental:
P/E: 16.9x (moderate undervalue)
Since last ATH NASDAQ:REGN has come up with wide ranges of successful clinical trial outcomes. Nonetheless, prices dropped due to competitive pressures on Eylea.
Last week, after significant clinical trial results of Odronextamab and Poze-Cemdi, the market moved up. However, the price slid after the BoA's PT revision.
Analyst sentiments: 17 buy, 7 buy, 1 sell (BoA)
The long possibility is high from now on.

REGN is oversold (the most since 1998)🐂 Trade Idea: Long - REGN
🔥 Account Risk: 20.00%
📈 Recommended Product: Stock
🔍 Entry: +/- 738.00
🐿 DCA: No
😫 Stop-Loss: 660.00
🎯 Take-Profit #1: 1,200.00 (50%)
🎯 Trail Rest: Yes
🚨🚨🚨 Important: Don’t forget to always wait for strong confirmation once possible entry zone is reached. Trade ideas don’t work all the time no matter how good they look. Do not get a victim of FOMO, there is always another trade idea waiting. 🚨🚨🚨
If you like what you see don’t forget to leave a comment 💬 or smash that like ❤️ button!
—
REGN is completely oversold (in fear of RFK) and so is the rest of the Pharma sector as well. Nevertheless, REGN is still printing money with double digit growth every year. The fear over political decisions in the US should be used to buy the Pharma sector. The last time REGN was that oversold was in 1998! For me, it is Novo and Regeneron. Both are long-term trades for several months. Upside potential is huge over the next 6 months.
—
Disclaimer & Disclosures pursuant to §34b WpHG
The trades shown here related to stocks, cryptos, commodities, ETFs and funds are always subject to risks. All texts as well as the notes and information do not constitute investment advice or recommendations. They have been taken from publicly available sources to the best of our knowledge and belief. All information provided (all thoughts, forecasts, comments, hints, advice, stop loss, take profit, etc.) are for educational and private entertainment purposes only.
Nevertheless, no liability can be assumed for the correctness in each individual case. Should visitors to this site adopt the content provided as their own or follow any advice given, they act on their own responsibility.

REGN Potential key support areaPlease pay close attention to this crucial support level. It previously served as a significant resistance level and also represented a period of market equilibrium and concentration.

REGNabove 1024 heading to 1065
an upward trend in the prices of an industry's stocks or the overall rise in broad market indices, characterized by high investor confidence
