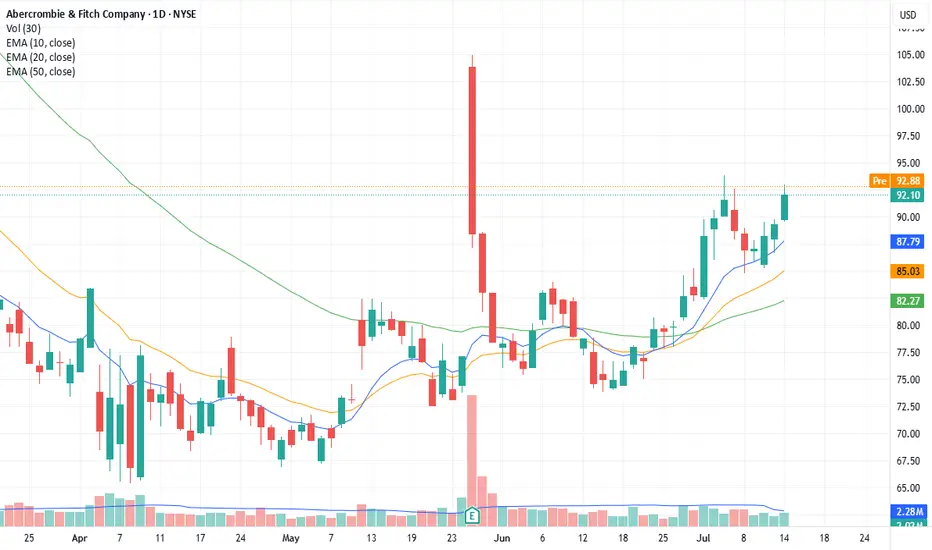
ANF break out1) uptrend since mid june
2) drying of volumes
3) breaking through the $92.10 line
4) entry $92, stop loss at $89.50
0R32 trade ideas
ANF - Short term upside NYSE:ANF is looking at a short term upside after the large bearish candle seen rejecting at 50% Fib retracement level fails to create a new low below 76 psychological level.
Currently, ANF is on the early uptrend and ichimoku shows a relative bullish signal after a bullish marobozu was seen closing above the 9 period conversion line.
Short term target could see 121.01, which is the 61.8% retracement level.
Long-term MACD histogram is positive and signal line is seen rising steadily after bottoming out

ANF | Direction: Long | Retail Resilience | (June 23, 2025)ANF | Direction: Long | Key Reason: Brand Recovery & Retail Resilience | (June 23, 2025)
1️⃣ Insight Summary
Abercrombie & Fitch is showing signs of a longer-term brand turnaround. Despite recent earnings disappointment, its historic strength, broad international footprint, and stable balance sheet support a multi-leg upside potential.
2️⃣ Trade Parameters
Bias: Long
Entry: Current range
Stop Loss: Below VWAP/volume shelf area (~$55–60 support range)
Take Profit 1: $61.90
Take Profit 2: $77.50
Take Profit 3: $95.50
Extended Targets: $100.35 / $131.00 / $154.00
3️⃣ Key Notes
✅ Established name – Founded in 1892, ANF is a globally recognized retail brand across apparel, personal care, and accessories.
✅ Global footprint – Operations across Americas, Europe, Asia-Pacific—diversification helps offset regional softness.
❌ Mixed earnings – Q1 2025 was below expectations. Despite this, some metrics (e.g., revenue surprise +16%) gave upside.
✅ Valuation edge – Market cap ($3.6B) is lower than revenue ($4.95B), and net income is strong ($566M).
✅ Balance sheet – While debt stands at $1B, cash and equivalents ($500M) keep it manageable.
❌ Sentiment watch – JP Morgan retained “Overweight,” but broader retail mood may affect near-term momentum.
⚠️ Caution – This is not a high-conviction play; money flow shows rapid in/out movement. Protect key value zones.
4️⃣ Follow-up Note
We'll monitor retail sector sentiment and technical structure. A clean break above $77 with volume would confirm momentum toward $95+.
Please LIKE 👍, FOLLOW ✅, SHARE 🙌 and COMMENT ✍ if you enjoy this idea! Also share your ideas and charts in the comments section below! This is the best way to keep it relevant, support us, keep the content here free and allow the idea to reach as many people as possible.
Disclaimer: This is not financial advice. Always conduct your own research. This content may include enhancements made using AI.

6/6/25 - $anf - Upgrading this to a buy ~$806/6/25 :: VROCKSTAR :: NYSE:ANF
Upgrading this to a buy ~$80
- low teens fcf yield
- single digit PE
- brand healthy and growing
- stock beat/ stock ripped
- company buying back shares
- when i compare to something like $lulu... i think... this name is already priced for recession and anything lower here beyond a degradation of the brand itself is getting greedy for the right reasons. on the topic of NASDAQ:LULU (which i commented on this AM as well post EPS)... you have to be more careful on entry, even tho let's also agree... the brand is defn stronger... but 3x better (px-valuation-wise)? well that's for u to consider
be well. might consider getting long this, in small size today
V

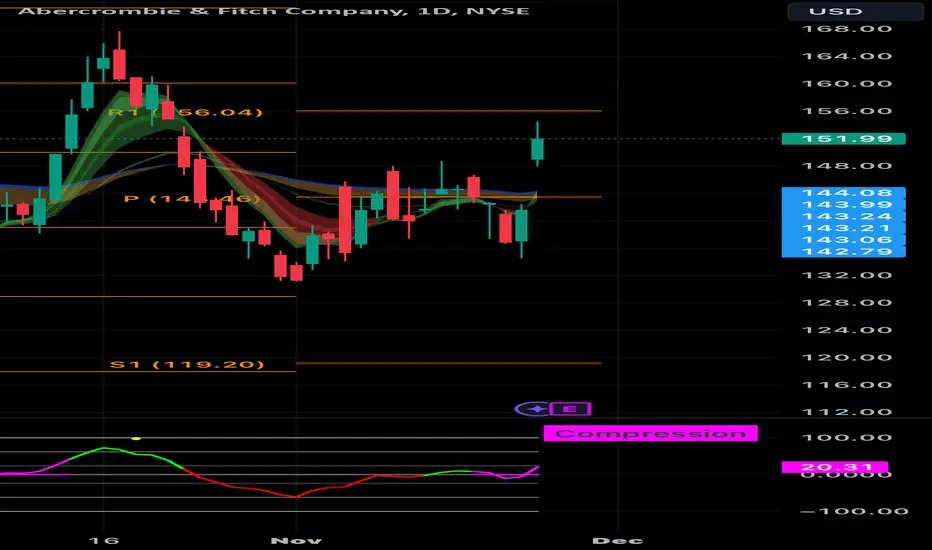
ANF Abercrombie & Fitch BELL CURVE SEEN.Abercrombie & Fitch looks to print a Bell Curve.
To date the Bell Curve Transform is not available without some manipulation of Sinusoids on the TV Platform that I can find.
While this is an early Study, time will tell that the theory should perform @ a 75% probability outcome.
Here the Risk to Reward Ratio is Low, so the probability of a Profit is High.
Investing does take time. I'm a strategic position Investor, and re-evaluate my positions at least every 3 months, as Trends do change, and one needs to adapt accordingly.
As allways if you are unshure please consult with your own personal investment Advisor before making any Trades or Investments as most are 12 months or more views.
Should you appreciate my comments and chart studies - please smash that like button. It's just a click away.
Regards Graham

ANF | Long Setup | Strong Fundamentals | (May 2025)ANF | Long Setup | Strong Fundamentals + Earnings Momentum | (May 2025)
1️⃣ Short Insight Summary:
Abercrombie & Fitch (ANF) shows solid financial strength with consistent growth outlook. Current valuation is attractive with potential upside toward key resistance levels.
2️⃣ Trade Parameters:
Bias: Long
Entry: Current levels around $72
Stop Loss: Below $62
TP1: $83
TP2: $95.40
Partial Exits: Can consider trimming risk near VWAP or key trend resistance
3️⃣ Key Notes:
✅ PE Ratio is 6.5 — undervalued compared to peers, with net income at ~$600M and ~$1.3B in free cash flow
✅ Revenue stands around SEED_TVCODER77_ETHBTCDATA:5B with market cap ~$3.48B — showing room for price appreciation
✅ Earnings per share and revenue are projected to grow significantly through 2027, with estimates of +132%
✅ Geographic diversification across Americas, Europe, and Asia Pacific helps stabilize long-term performance
✅ No immediate red flags in debt or liquidity — free cash flow and cash equivalents cover debt well
4️⃣ Optional Follow-up Note:
I’ll be watching VWAP and upper trendline resistance for signs of pressure. Will update if key zones break or earnings surprise shifts structure.
Please LIKE 👍, FOLLOW ✅, SHARE 🙌 and COMMENT ✍ if you enjoy this idea! Also share your ideas and charts in the comments section below! This is best way to keep it relevant, support us, keep the content here free and allow the idea to reach as many people as possible.
Disclaimer: This is not a financial advise. Always conduct your own research. This content may include enhancements made using AI.

Sitting on a long term supportPrice is oversold in the weekly and daily timeframes. Also is consolidating on the monthly support trendline. I think is going to test the $105 resistance area that's a 30% upside. SL triggers if a weekly candle closes as shown.

SHORT ANFLooking for a retest, before entering into a short position. The consumer is tried imo, and growth is stalled.

ANF 3d Q1 2025ANF printing one of my favorite patterns to follow. After a parabolic last few years, finally topping in a similar style to NASDAQ:SMCI and $ARKK. Not expecting this to go straight down, but short of a miracle, this is looking like a parabolic top and distribution.
For reference,

ANF Abercrombie Reversal begins 1990s are back This one is going to float higher as the upper middle class conservatives ramp up glamour spending under POTUS Trump


Watch out for this symmetrical triangle patternANF tried to break triangle with upward breakout, but rebounded. It's very close to the end of the triangle. So watch out for breakout in either direction.
Once breakout is confirmed, for upward breakout, immediate target will be $180+.
For downward breakout, around $110

ANF long after Breaking out the TtriangleDay Time Frame
Long : Buying point at around 161 after breaking out the triangle;
First target at 195;
Second Target at 232;
Stop loss at around 146

ANF be aware if this consolidation breaks downtarget around 88$ if this wedge breakdown, otherwise a break above 150 is needed for further upside

ANF rocket fuel primed: Price Discovery ActivatedGreetings Everyone,
I couldn’t delay sharing this exciting analysis on Abercrombie & Fitch (ANF), as it’s showing a significant technical setup that demands immediate attention.
Supplementary Photos:
www.dropbox.com
🌀 ANF’s Fourth Wave Triangle: What’s Unfolding?
Abercrombie & Fitch is currently forming a classic 4th wave triangle as part of a larger Elliott Wave structure. Based on my analysis, it appears this consolidation phase has just completed, setting the stage for a potential breakout into the 5th wave. Here’s why this matters:
📈 Key Insights into ANF’s Wave Structure
Fourth Wave Triangles in Elliott Wave Theory
Fourth waves often manifest as contracting triangles—periods of lower volatility and sideways price action.
These patterns serve as a pause in the trend before the final impulsive wave (Wave 5).
ANF’s price action fits this structure perfectly, with decreasing volume during consolidation, a hallmark of Elliott Wave triangles.
What’s Next? : If the triangle breakout is confirmed, I anticipate a strong 5th wave rally.
Support and Resistance Zones
The lower boundary of the triangle is providing robust support, while the breakout level near the upper resistance aligns with key Fibonacci retracement levels.
Monitor for volume spikes as price approaches the breakout zone—this will validate the bullish move.
Volume Dynamics
Similar to what we’ve seen in past examples (like Chainlink’s accumulation breakout), volume during the breakout phase is crucial. ANF recently showed strong buying pressure near the triangle’s apex, indicating potential momentum.
📊 Strategy and Risk Management
To maximize this opportunity, here are the key levels and strategies to consider:
• Entry Point: A confirmed breakout above the triangle’s resistance with sustained volume.
Stop-Loss: Place stops just below the triangle’s lower boundary to limit downside risk.
Target: Based on Elliott Wave projections, the 5th wave could aim for 1.618 extension of Waves 1–3. Keep this level in focus as a profit-taking zone.
Invalidation: A breakdown below the triangle would signal that the 4th wave correction is incomplete or that the larger wave structure is failing.
Why This Setup is Important
Abercrombie’s breakout would align with:
• Broader market recovery trends.
• Improved earnings performance (as seen in its Q3 highlights).
• Continued strength in consumer spending and brand expansion efforts.
Closing Thoughts
This is a pivotal moment for ANF. With the completion of the 4th wave triangle

ANF: Positioned for Growth Amid Strong Financial MomentumAbercrombie & Fitch Co. ( NYSE:ANF ): Positioned for Growth Amid Strong Financial Momentum
Trade Setup:
- Entry Price: $151.35 (activated)
- Stop-Loss: $110.18
- Take-Profit Targets:
- TP1: $205.94
- TP2: $291.21
Company Overview:
NYSE:ANF is a leading specialty retailer offering casual apparel and accessories under brands like Abercrombie & Fitch and Hollister, catering to diverse demographics globally. The company has demonstrated resilience and adaptability, maintaining its relevance in a competitive retail market.
Financial Performance:
- In Q3 2024, NYSE:ANF reported a net income increase of **10.9%**, totalling $131.98 million.
- Revenue grew **14% year-over-year** to a record **$1.21 billion**, marking six consecutive quarters of double-digit growth.
- The company continues to expand its digital and physical presence, enhancing customer engagement and operational efficiency.
Analyst Ratings:
- Analysts have a consensus **"Moderate Buy" rating** on NYSE:ANF , with a median price target of **$190**, suggesting upside potential.
- Optimistic price targets range up to $250, reflecting confidence in NYSE:ANF ’s ability to sustain its growth trajectory.
Risk/Reward Analysis:
- The stop-loss at **$110.18** limits downside risk to approximately **27%** from the entry point.
- Take-profit targets at **$205.94** and **$291.21** offer potential upside of **36%** and **92%**, respectively, creating a favourable risk-reward scenario.
Conclusion:
NYSE:ANF continues to demonstrate strong financial performance and positive market sentiment, supported by robust revenue growth and strategic initiatives. This trade setup balances calculated risks with the potential for significant returns.
When the Market’s Call, We Stand Tall. Bull or Bear, Just Ride the Wave!
*Disclaimer: This analysis is for informational purposes only and does not constitute financial advice. Traders should conduct their own due diligence before making investment decisions.*


Small risk for big gainANF is reporting earning Tuesday morning. Consider opening at debit calendar spread to take advantage of theta decay. Sell $175 November 29 call, and buy $175 December 6 call for debit price of $90. Max profit of over $900 if held to expiration but DO NOT do that due to risk of assignment. Close the trade for a nice profit of $100-$200.
Even if price fall to $135. Risk is only losing $41 of the price paid.
Good luck.
Learn more about debit put or debit call calendar spread for earning trade.
Ahead of $NYSE:ANF EarningsThere is an unfinished Bullish flag that formed in April and earnings may be the spark needed to propel the price to the $210 target.
NYSE:ANF may be breaking out of a wedge pattern, with the price gapping up and outside of the wedge today.
Earnings are reported on Tuesday ahead of the market open.
My plan is to open a position IF the stock remain above the wedge during Monday's trading.

ANF Triangle breakoutANF seems to be on the verge of breaking out of the triangle sideways consolidation. A move to the upside seems likely if we consider this a wave 4 triangle. Confirmation would be received with a weekly candle close above the triangle.

ANF eyes on $145 : about to Break Out from Major Resistance?Followup to my previous Swing Trade plot (click).
ANF peaked exactly at our Genesis fib at $196.93
The pullback has been strong but controlled so far.
Now trying to paint a bottom if breaks resistance.
Previous Analysis:
==================================================================
.

ANF - Forming a new baseANF
Still forming a base after last run but will be keeping close watch on this one as it may present early opportunity as it moves above key pivot levels

Market Update - 9/22/2024• equities positive after rate cuts, but
• NASDAQ:TLT sold off and energy was the best performing sector this week, along with other commodities, might signal expectation of inflation picking back up and the FED having to keep rates higher
• the 50bp cut is also something that would be fueling inflation, as long as the economy doesn't go into recession
• changed my strategy and watchlist to only focusing on the best setups and nothing else, need to reduce effort and master just one strategy
• lots of missed opportunities this week, mainly NASDAQ:CEG and mistakes, like NASDAQ:KINS , NASDAQ:CORT
• even though I'm long, the sector strength of healthcare, utilities, energy are typically not the leading ones in good economic conditions, so we could see sector rotation and money going into defensive sectors, while cyclicals underperform.
• at the same time, some semiconductors are setting up well like NASDAQ:NVDA , NASDAQ:AMSC and NASDAQ:AIRG
