FICO's Monopoly: Cracks in the Credit Kingdom?For decades, Fair Isaac Corporation (FICO) has maintained an unparalleled grip on the American credit system. Its FICO score became the de facto standard for assessing creditworthiness, underpinning virtually every mortgage, loan, and credit card. This dominance was cemented by a highly profitable business model: the three major credit bureaus—Equifax, Experian, and TransUnion—each paid FICO for independent licenses, generating a significant percentage of revenue per inquiry and establishing a seemingly unassailable monopoly.
However, this long-standing reign now faces an unprecedented challenge. The Federal Housing Finance Agency (FHFA) Director, Bill Pulte, recently signaled a potential shift to a "2-out-of-3" model for credit bureaus. This seemingly technical adjustment carries profound implications, as it could render one of FICO's three bureau licenses redundant, potentially evaporating up to 33% of its highly profitable revenue. Director Pulte has also publicly criticized FICO's recent 41% increase in wholesale mortgage score fees, contributing to significant declines in FICO's stock price and drawing broader regulatory scrutiny over its perceived anti-competitive practices.
This regulatory pressure extends beyond FICO's immediate revenue, hinting at a broader dismantling of the traditional credit monopoly. The FHFA's actions could pave the way for alternative credit scoring models, like VantageScore, and encourage innovation from fintech companies and other data sources. This increased competition threatens to reshape the landscape of credit assessment, potentially leading to a more diversified and competitive market where FICO's once-unchallenged position is significantly diluted.
Despite these formidable headwinds, FICO retains considerable financial strength, boasting impressive profit margins and robust revenue growth, particularly within its Scores segment. The company's Software segment, offering a decision intelligence platform, also presents a significant growth opportunity, with projected increases in annual recurring revenue. While FICO navigates this pivotal period of regulatory scrutiny and emerging competition, its ability to adapt and leverage its diversified business will be crucial in determining its future role in the evolving American credit market.
0TIQ trade ideas
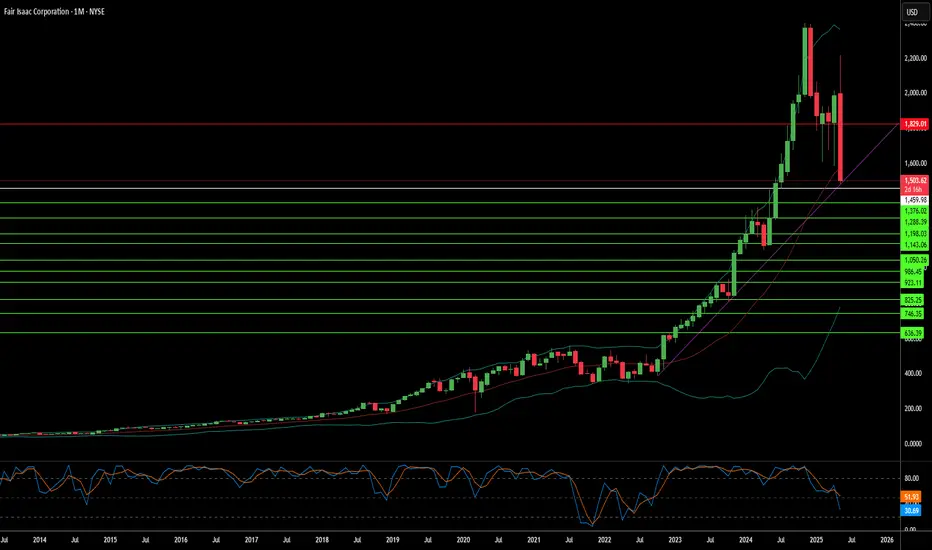
Looking to get into ficoThis may take awhile to play out because i think this correction will be very choppy. But I have alerts/buys setup to but at $1300. Fundamentally and technically this seems like a good area to buy into this high quality business. Green horizontals are my levels of interest, i'd like to see these hold or break and then recover quickly. The 50 month ema has been a good spot to buy historically, that looks to be in play as time progresses.

Fair Isaac at fair value?The chart suggests we topped out in Wave 5, now we’re in the wave C of a corrective move. Great company, but trading above its fair value. I wouldn’t touch this stock until the correction is over and we find a base. There’s levels of support below, so keep an eye out on this one if you want to go long or invest in this great company.
Not financial advice

$FICOFICO has formed a textbook double bottom, signaling a bullish reversal. The stock surged ~18% from the pattern’s low (~$1,600) to the breakout above the neckline (~$1,910). Simple TA suggests a total move of ~36% from the bottom, targeting ~$2,300. With the breakout confirmed and FICO halfway through the post-breakout move (~9% gained, ~9% remaining), there’s still meaningful upside. Volume confirmation and strong fundamentals support the move, along with earnings.

About to curve on the MACD but still has major support at 280sThe MACD is already positioned to start curving the stochastic, and the RSI is way oversold but can run flat daily along with a DT on the RSI, with no confirmation on other indicators or oscillators. This is headed towards filling a gap beginning at the 1980 mark, but I wouldn't be surprised to see it hit the 1960s when the Bollinger starts to narrow, which could also be used as support, short term.

HOW ABOUT ANOTHER 100 DOLLAR SWING?With the pattern slowing, it has formed into a double-top pattern and a sideway moving pattern; I am more confident in the latter theory. We shall see, but confidence in short-term bears.

up trend movement with a slight retrace with current conditionsThe moving averages are heading higher. The one thing you see with this type of movement is that unless there is a massive shift in change, the pattern continuation will continue to rise.

Everything points in the direction of a retrace to 1800Overextended, overbought, on every indicator this is in overbought territory. It hasn't indicated it on a reversal format although it is showing signs of a correction.

FICO bullish formation for 1500 target"The chart formation for FICO stock is bullish, displaying a strong bullish candle pattern. I predict a target of $1500 on the weekly chart."

$FICO: Hey? Trend line? That's you?Hey, not saying this is a strong trend line, seems like a light one but could still be used if you want to play risky and bet for a long here...


Will $FICO continue its ascend? After the bottom in May of 2022, the price gapped up and broke through its resistance in $550.
Then formed a base to digest this move before continuing its trend up, this was my signal to buy as it broke out above $636. After that it didn't follow through and its RSI signaled weakness so I sold.
I don't like to hold positions that aren't going anywhere even if I'm on profit.
Still, its relative strength againts its benchmark ( AMEX:IJH ) shows leadership and the price is still near highs so, I'll wait and see if it can breakout this base-over-base.
The RS ratio already broke out, the price could follow.
If not, I won't buy it again.

$FICO with a Bullish outlook following its earnings #Stocks The PEAD projected a Bullish outlook for $FICO after a Negative over reaction following its earnings release placing the stock in drift C with an expected accuracy of 75%.

FICO Announces New Stock Repurchase Program!!!FICO: Fair Isaac Corporation
2022-01-27 09:00:00
FICO Announces New Stock Repurchase Program

FICO Announces New Stock Repurchase ProgramFICO: FICO
2021-11-30 16:00:00
FICO Announces New Stock Repurchase Program


$FICO with a slight bullish outlook after earnings$FICO posted its earnings with positive under reaction following the release with the PEAD projecting a slight bullish outlook for the stock.
If you would like to see the Drift for another stock please message us. Also click on the Like Button if this was useful and follow us or join us.

Look at the signs before going LONG4Price action tells you a lot about the timing to go long or short. Some traders got it fairly accurately, able to catch the bottom or top while others still find it illusionary and mysterious.
Now, let's say you have done your research and are keen to buy this stock.
By looking closely at the chart, it tells us several things :
1. Price has come to some sort of a standstill since early June
2. It stays sideway for a while before attempting to break out of the resistance at 436.98 on 31 July 2020.
3. It failed and tumbled down until 31 August 2020.
4. On 1st Sept, 17th Sep & 7th Oct - it tried to break out again but both attempts were failure.
5. Now, we are at the bullish trend line and within this week, it will attempt once more to break the resistance level. If it cleared the 436.98 level, it might face another challenge at 450.47. This critical level must be broken up before we can consider it to go even higher.
6. Failure to do so, we can safely expect the price to tumble to 400 level. There, we have to wait and see if it gains any support. If not, the next level will be 346.52.
With this basic information, if you want to long this counter, does it not tell you to be patient and put it in the watch list first ? We want to buy low, like 346.52 or 400 compared to current price and the only way to get at that price is to WAIT. Being patient is a virtue in investing and one must learn to cultivate that.
However, there is a difference between being patient and being a procrastinator. The latter appears to be patient on the surface but in reality, he finds excuses why he should not go long. He has too many "What ifs" on his mind and choose to wait to see the outcome first. He needs assurance and safety but his commitment to action is minimal at best. He kept waiting , believing given time, he will have more resources, better equipped , blah blah blah to make his decisions. In actual fact, he did not take any action other than inaction.
Analysis paralysis in any facets of our lives serve us no purpose. There are always fresh information that can affect the price , the company's revenue or a new competitor ,etc. We can't have COMPLETE information on hand before making a decision. We deal with what we have on hand and make a projection , based on past historical patterns and data provided.
The outcome will tell us what is the probability of us being right or wrong OVER TIME.

#FICO #Breakout Alert from 2 months #rectangle #ChartPatternNYSE:FICO had 2 daily closes above its ALL time highs showing signs it wants to breakout of its 2 months rectangle consolidation chart pattern.
Keep it Simple!

FICO Announces New Stock Repurchase Program!!!FICO: FICO
2020-07-29 06:30:00
FICO Announces New Stock Repurchase Program


