6954 - 5 months HEAD & SHOULDERS══════════════════════════════
Since 2014, my markets approach is to spot
trading opportunities based solely on the
development of
CLASSICAL CHART PATTERNS
🤝Let’s learn and grow together 🤝
══════════════════════════════
Hello Traders ✌
After a careful consideration I came to the conclusion that:
-
Next report date
—
Report period
—
EPS estimate
—
Revenue estimate
—
0.5 USD
920.86 M USD
5.50 B USD
About FANUC CORPORATION
Sector
Industry
CEO
Kenji Yamaguchi
Website
Headquarters
Minamitsuru-gun
Founded
1950
FIGI
BBG00LJZ6DF4
FANUC Corp. engages in the development, manufacture, sale, and maintenance of computer numerical control (CNC) systems, lasers, robot systems, robomachines, robocop, robocut and nano robots. It operates through the following divisions: Factory Automation (FA), Robot, and Robomachine. The FA division provides products that enable factory automation, such as CNCs, which control machine tools with numerical information, servos and laser oscillators. The Robot division tasks can be automated by applying the basic technologies of CNCs and servos freely controlling robot arms. The Robomachine division develops compact machining centers, electric injection molding machines, wire electrical-discharge machines that apply the basic technologies of CNCs and servos. The company was founded by Seiuemon Inaba in 1955 and is headquartered in Minamitsuru-gun, Japan.

FANUC Robotic Manufacturing Assistance JPN future growth FANUF FANUC FANUC CORPORATION is a Japan-based manufacturing company mainly engaged in the provision of factory automation (FA) machinery. The Company operates in three business segments. The FA segment is engaged in the development, manufacture and sale of FA products, such as computer numeric c

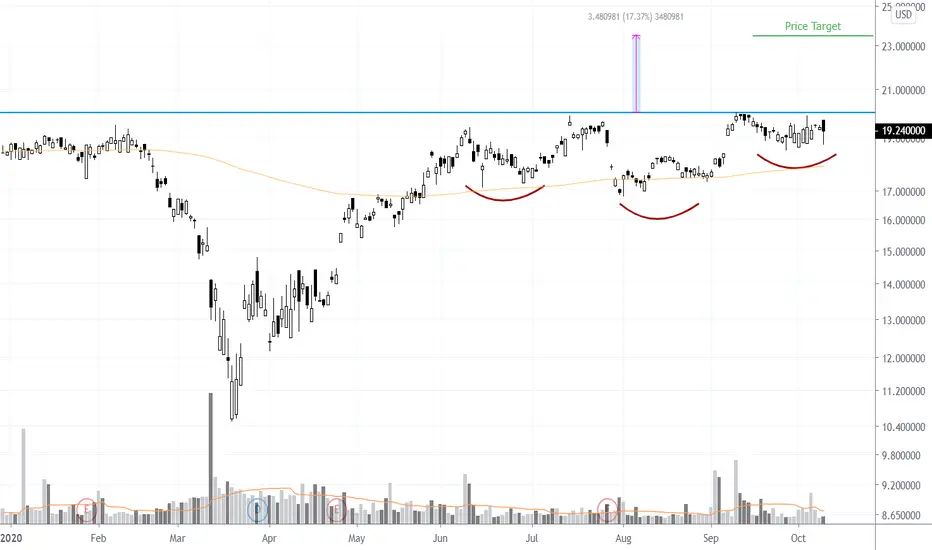
$FANUY 5 Month #HeadandShoulders #Continuation #ChartPatternOTC:FANUY is forming 5 month possible head and shoulder continuation chart pattern. The $20 chart pattern neck line has been tested numerus times through out the years going back all the way to mid 2018 (zoon out to the weekly chart for the bigger picture).
A daily close above $20 will finally br

Fanuc - LongEXPERIENCE IN INTEGRATING AUTOMATION AND ROBOTICS WITH AI - WILL CREATE A NEW BREED OF ROBOTS

See all ideas
Summarizing what the indicators are suggesting.
Neutral
SellBuy
Strong sellStrong buy
Strong sellSellNeutralBuyStrong buy
Neutral
SellBuy
Strong sellStrong buy
Strong sellSellNeutralBuyStrong buy
Neutral
SellBuy
Strong sellStrong buy
Strong sellSellNeutralBuyStrong buy
An aggregate view of professional's ratings.
Neutral
SellBuy
Strong sellStrong buy
Strong sellSellNeutralBuyStrong buy
Neutral
SellBuy
Strong sellStrong buy
Strong sellSellNeutralBuyStrong buy
Neutral
SellBuy
Strong sellStrong buy
Strong sellSellNeutralBuyStrong buy
Displays a symbol's price movements over previous years to identify recurring trends.