$DOCU breakdownAnother case of hot stock from yesterday that is breaking down. Possibly the bullish case is over here, maybe earnings surprise will save it but I doubt. It's time to ride it down.
0XNH trade ideas

Docusign double topThese covid stocks will pull back in the next couple of weeks in sympathy with Pton guidance announcement.
Docu fell significantly Friday but bounced off fibonacci support at 264.
Our trendline now aligns with that fibonacci support at 264 so a drop beneath that number would be a break beneath 2 crucial supports. Friday closed on high selling volume, let's see if it was an over reaction to pton news or is there some follow through.
Short entry
263
stop loss 264.50
Target 203 (Gap close)

DOCU RoundDOCU is showing an upward round trending formation and held the moving averages with a green doji candle. Looking to continue the upward momentum before earnings are reported. A break below todays low would indicate a break in trend

DOCU Short setup 10/25/21Shout out to @ChartGalDinz for this setup on DOCU. Looking to enter at a break 0f 273 with a tight stop at the hourly lower high. Target 1 is at the 268 lvl

Long $DOCU CMP $271.16Long $DOCU CMP $271.16. Though trading below 50 EMA. I am expecting it to bounce back from $260-270 range to major Fibonacci support level $293. Watching price to reclaim 50 EMA. Fading negative MACD histogram. Possible Target $310

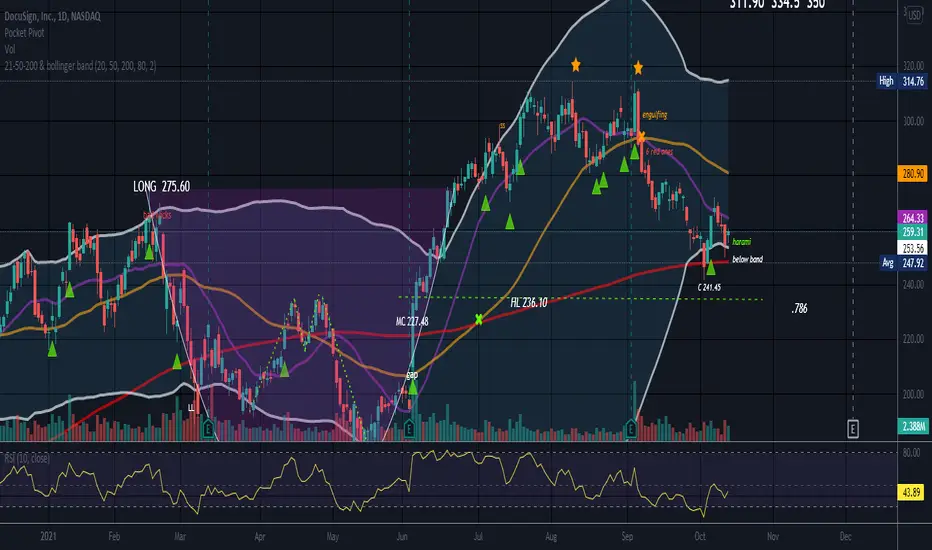
Cup and HandleCup and handle pattern but also see an ABC bullish pattern and C is marked.
Price went below bollinger band set on 80 and was also oversold at that juncture. If price is above the bands on this setting it is usually overbought and vice versa. Price eventually returns to the bands.
Monthly candle is a green long legged doji so indeterminate.
Mid cup can be a strong level of support if all else fails. The handle low can also be support. Mid cup is 227.48 Handle low is 236.10 and C is 241.45 and all can serve as support.
Negative volume had slumped recently but there is a smart money footprint, a pocket pivot, below price (green triangle)
Very bearish string of red candles coming down but sometimes this can flush out sellers. When most are gone, buyers can appear.
Bullish harami today but needs confirmation. Price is under the 50 and the 20 and teetering on the 200. The 200 SMA continues to slope up.
No recommendation.

Docu 4H shorthead & shoulders and a lot of divergences between indexes, decreasing volume buyers, bulls beware

Awaiting Clear confirmationMy theory on this stock is as follows
- strong buy rated stock with a long term positive outlook
- clear channel boundaries that have been respected excluding a large sell off
- Evidence it is bouncing off the previous range before the sell off
- Last weeks candle and hopefully this weeks candle show a clear indecision in the market (hammer pin bar or something similar) alongside last weeks candle would be fantastic.
My bias would be to go long.
If your view is long term my theory is this trade will be correct.

$DOCU with a Bullish outlook following its earnings #Stocks The PEAD projected a Bullish outlook for $DOCU after a Negative Under reaction following its earnings release placing the stock in drift A.
If you would like to see the Drift for another stock please message us. Also click on the Like Button if this was useful and follow us or join us.

9/20 DOCU(1) DOCU touched the support
(2) volume came in last week and last friday
(3) weekly chart looks ok for far

DOCU Breakout$DOCU power of three play with all ema's stacked together. Positive earnings reaction. Targeting 1.618 fib extension.
Trigger: Price > $314.5
Target: $325
Trade Vehicle Options (2-4 weeks out):
9/17 $325C @ $3.60
9/24 $325C @ $5.35
10/1 $325C @ $7.50

Long $DOCU CMP $299.13Long $DOCU CMP $299.13. Good consolidate from last few days. Forming flag. Above all moving averages. Possible target $315 in coming days

DOCU Earnings Run UpLooking for a bounce from the golden pocket heading into earnings. Must hold this level here. Trade invalidated with a daily close below the .786 ($279) fibonacci retracement level.

Docusign Analysis 17.08.2021Hello Traders, here is a full analysis for this asset. The entry will be taken only, if all rules of your trading plan are satisfied.
Therefore I suggest you keep this pair on your watchlist and see if all of your rules are satisfied.
Leave your thoughts in the comment section, I will reply to every single one of them.
P.S. Tell me which asset you want me to break down next and I will cover it in my next analysis
_____________________________________________________________________________________________________________________________________________________________________

Classic Double TopWhat Is a Double Top?
A double top is an extremely bearish technical reversal pattern that forms after an asset reaches a high price two consecutive times with a moderate decline between the two highs. It is confirmed once the asset's price falls below a support level equal to the low between the two prior highs.
What Does A Double Top Tell You?
A double top signals a medium or long-term trend change in an asset class.
A double top is a bearish technical reversal pattern.
It is not as easy to spot as one would think because there needs to be a confirmation with a break below support.
Next Support levels will be
270
261
247
Reference Article:
www.investopedia.com

DOCU - Consolidation on pullback (8/16/2021)Strong leader breaking out of a long term stage 1 consolidation. First consolidation since started stage 2 uptrend. Volume is also drying up which could mean sellers are tired.
Entry: $298ish
Stop: $291ish
Risk: 2.3%

DOCUAnalysts began to increase the price, so let's assume that the correction ended within wave 4 and wave 5 awaits us. Suppose that wave 3 is already in progress within wave 5, so we will wait for the correction to 264 and holding the level or breakdown of 289, holding and continuing the movement to our goal.
Pay attention also to the presence of the formation of small bearish divergences on the RSI, MFI, which may be just a harbinger of the fact that there should be a small correction. (also that this is the end of growth)


DOCU Long and Short callsRiding nicely in channel up and coming off bottom. Picked up calls at low of channel yesterday and swinging for gains

DOCU Long callsI'm in on commons plus opened up call position yesterday at bottom of channel. Seems consistently on uptrend in channel

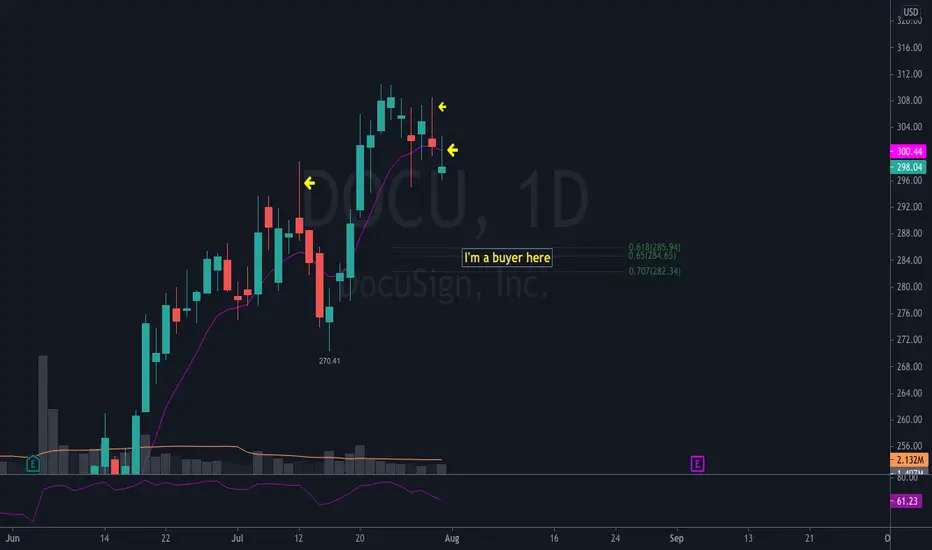
DOCUone of my favorite lines is "upper wicks are for selling". I believe this name is exhausted. I'm looking for a move much lower, where I can be a buyer in the $280 range.
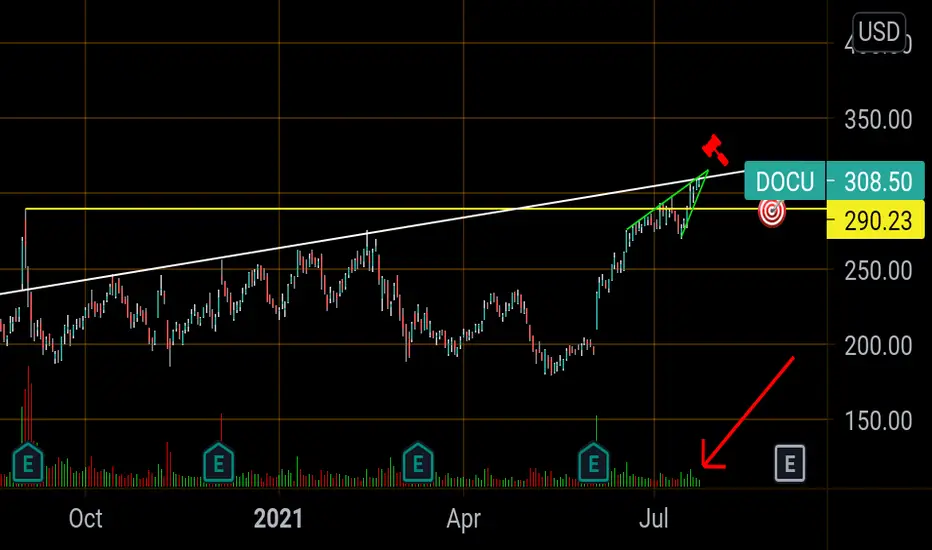
Docu Rising wedge1.Showing rising wedge
2. Decreasing Volume
3. outside bollinger bands
4. overbought on RSI