0XVU trade ideas
the 92.5 layer dip #ZS $ZS the 92.5 layer dip ;)
this is a textbook bearish downtrend channel, very tempted to short after charting this one out haha.
as long as we don't break trend resistance we most likely visit 99.19-58.30 in the future!

$ZS with a Bullish outlook following its earnings #Stocks The PEAD projected a Bullish outlook for $ZS after a Positive Under reaction following its earnings release placing the stock in drift C.

ZS - MegaphoneA megaphone has formed on ZS
Price may fall towards the bottom megaphone trend line as indicated by the double curved line
This will ultimately result in a bullish rejection however on this daily timeframe

ZS massive channelMassive descending channel on ZS with a possible retest of upper trendline.
If you zoom in on a smaller time frame (1HR) you can clear see some resistance at 163.94 / 164 level. This level has been holding for a week now.
If that level breaks, there is not much resistance until 186 which is 5/22 lows and trendline from the highs in December. A great R:R trade.

ZS - Downward ContinuationDownward continuation as this strong resistance is in effect
Green circle is the point at which this trend line is broken and an upward shift is seen (in white)

ZS downside idea. 5/9/20 EMAs converging downwards on the daily. Noting downward converging 5/9/20 EMAs on the daily. Testing Uptrend Line. MACD has already bear crossed.

Short the Nasdaq Futures Contract at the 38.2% Now.Whether you wish to use QQQ or /NQ short Nasdaq at the value now 15045.88 up to the hi of 15068 (/NQ), I predict that the Nasdaq will be lower in the morning than it is now, before the Consumer Price Index is published at 8:30. Its anybody's guess as to if the Nasdaq will drop precipitously after a poor report showing inflation is continuing to rise. This is a short term play to do now, if you believe as I do, that the Nasdaq is overbought in the last two days. I began shorting the market, the second week in November and am convinced we are in for a major bear market, as I was at that time. If you trade short futures tomorrow, wait for confirmation with a downward spiking red candle and try to sell slightly higher than the lowest spike on a 5 minute chart. This is not financial advice. so, proceed at your own risk.

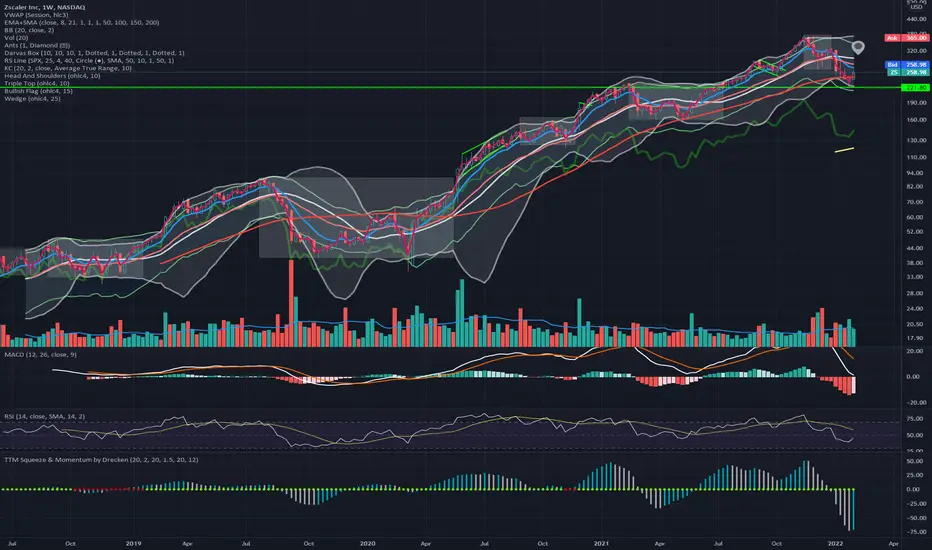
Own a piece of Zscalar stock. Look at the weekly chartWeekly chart of NASDAQ:ZS looks very promising. Own some here and keep a loose stop. Expect zig zag and resistances
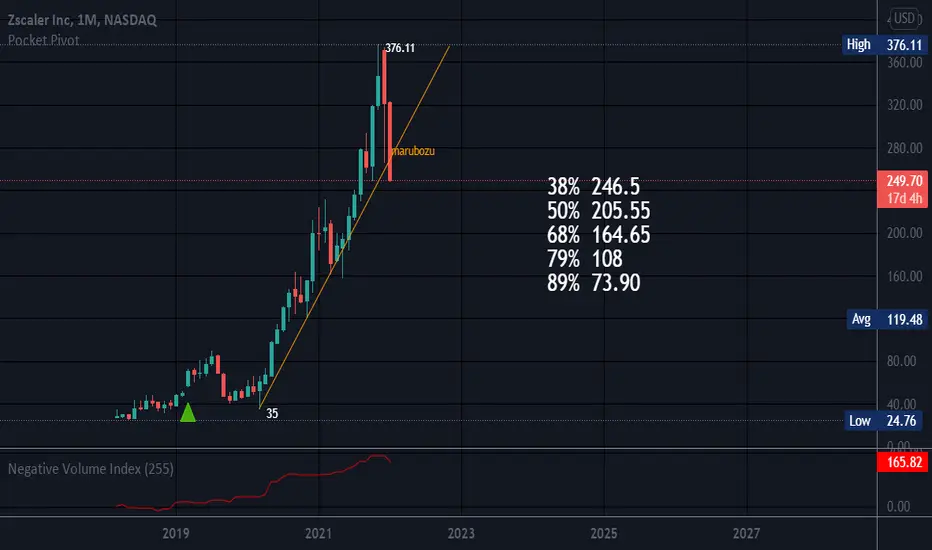
Parabolic Arc?Perhaps but ZS went from 35 to 376.11 and is pulling back.
Short interest is 9.76%. Negative volume remains high. Oversold on MFI but not on RSI.
If this is indeed an arc, then on average they fall between 62% and 79%, or between the 0.618 and 0.786 fib levels, but can fall less or more than these levels. often a security will take a breather at the 50% mark. There are usually rallies up on the way down, but be safe as this gives buyers who are stuck up there and opportunity to sell, and they will once they figure out what is going on. Hence, bear flags and bearish patterns can form.
Parabolic Arcs are due to irrational exuberance and cause a very steep, unsustainable, rise and easiest to see on weekly or monthly time frames. It is difficult to trade an ARC on the way down as they can be volatile for some time to come. It is also possible that during the initial fall, some folks are still bullish and are astonished the security is falling.
No recommendation.
It can important to look in the rear view mirror.
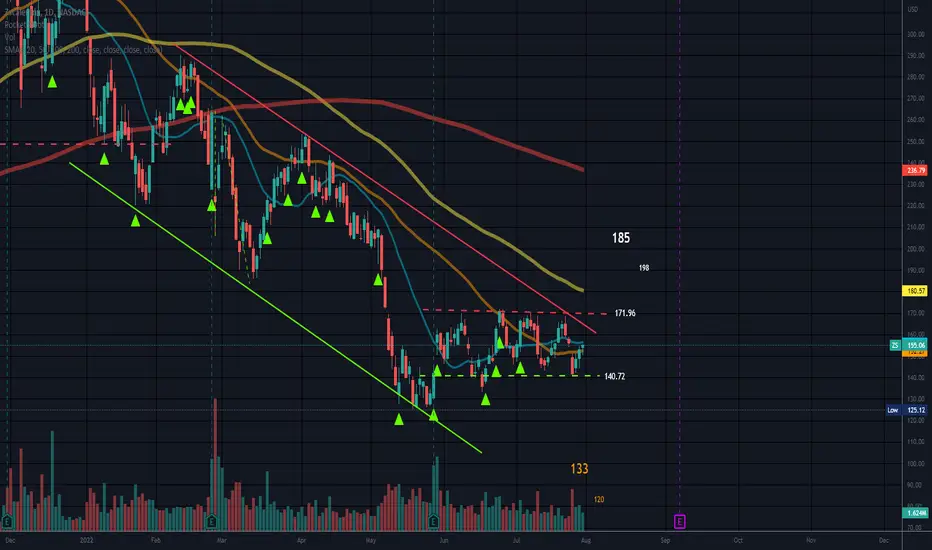
Zscaler headed back to 150Cyber security stocks have had an incredible 18months but since Nov
OKTA
CRWD
NET
Have been getting dumped by institutions. In 2022 I dont think the bleeding will stop.
Zscaler is currently showing a massive H&S here. I think ZSCALER will be 150 by this summer. Set your alerts.

ZS.L.2101Discover Zscaler Internet Access. Find Quick Results from Multiple Sources. Get Zscaler Internet Access. Get Instant Quality Results at iZito Now! Explore the Best Info Now

US Stock In Play: $ZS$ZS supported on 10/20MA crossover, along with AVWAP from high.
significant day as it will be contesting a rising 50DMA again this week at $332.55. relative weakness is displayed on RS's 50MA against price 50MA.
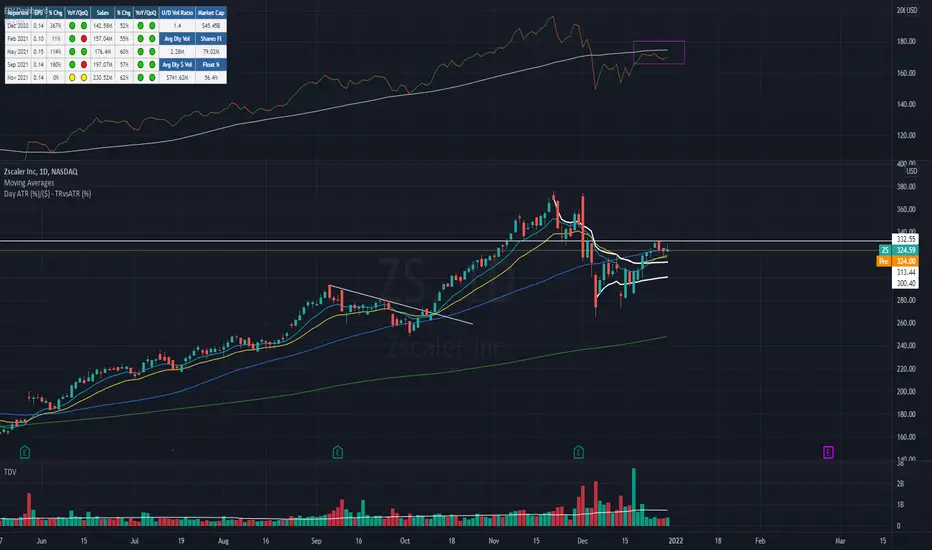
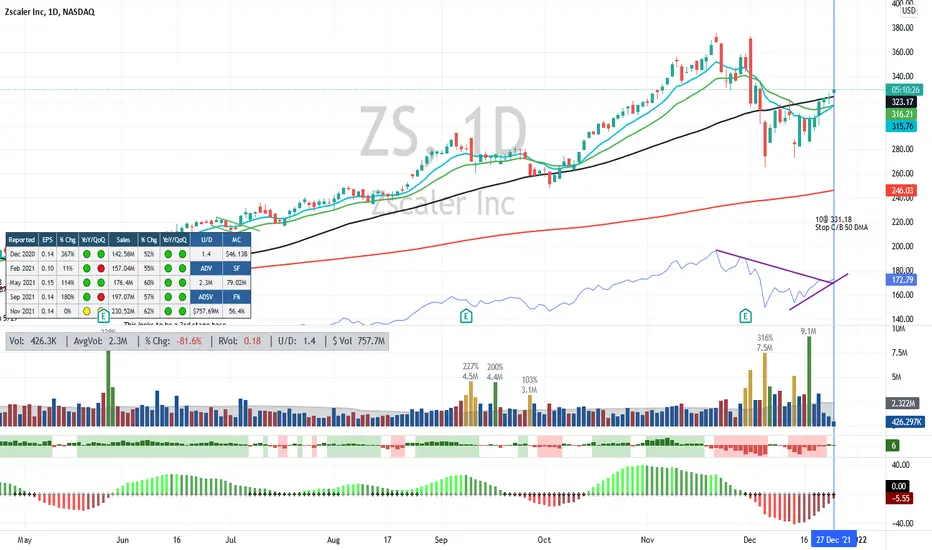
$ZS Recaptures 50 DMA$ZS I've traded this name very well in the past. Took it again this morning as it recaptures the 50 DMA. It is also above the rising 10 and 20 EMAs. Big accumulation volume on Dec 17 and RS broke downtrend line and is rising. All good reasons for me to give it a try. Stop is a close below the 50DMA. Ideas, not investing / trading advice.
$ZS... beat up after earnings reversal... holding support so farThis name to be added to the Nasdaq 100 around Dec 17... worth keeping an eye on as it holds support...

Idea about $ZSZscaler is a cloud-based information security company. The company has more than 100 data centers with clients in 185 countries around the world. Most of the clients are located in the United States. Revenue of $673 million (2020). Capitalization of $51.2 billion.
A deal for a false breakout of the extremum ($376).
1) The closing of the daily candle is far from the extreme
2) Approach to the level on candles significantly exceeding the ATR
Short: $376.2
Target: $361
Stop above $381
NOT IRR.

ZS Snapback/BounceZS has ran up right into its previous ATH. This is the first test of that high, and it comes after being overbought on stochastics and after 4 consecutive green run-up days pushing it to overextended levels piercing above the upper bollinger band. This level will act as resistance with 300 mark also acting as a physcological level of resistance, which is where my stop is around. There is supply at this level and will most likely sell off from here back to true range around 282


ZS Falling wedge break outZS - Broke out the falling wedge. Need one more green day to confirm .
MACD : Curled and very bullish.

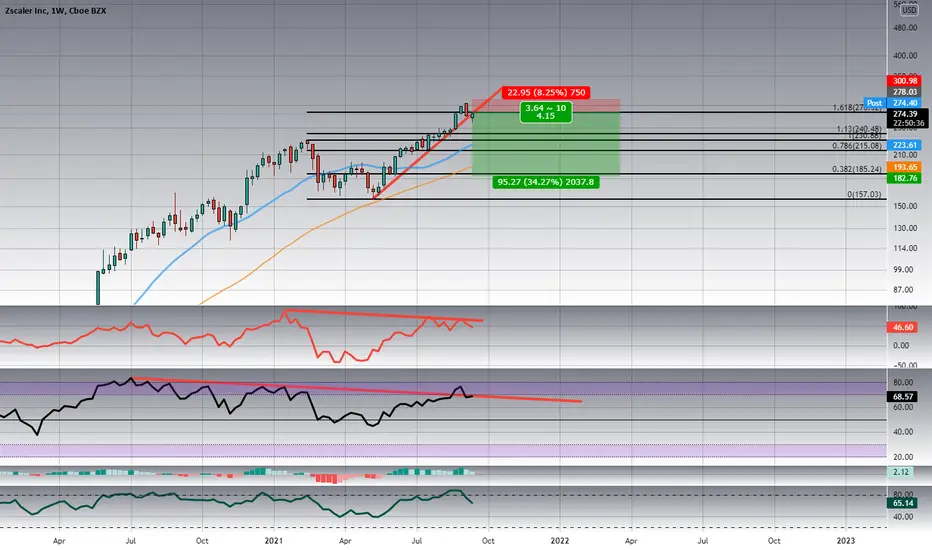
Weekly Bearish Engulfing at 1.618 Fib ExtensionWe have bearish divergence on momentum and rsi at an important fib lvl after breaking the trend and bearishly engulfing on the weekly
ZS EMA PullbackZS has crossed over its 13 EMA and pulled back to test it today holding the level. Looking for a run up in the range to 285.

untenable & overbought. Not long termA correction will hit this one hard. Standardized reporting shows a widening gap in losses. Moreover, Analysts seem to be making big mistakes in estimates.
