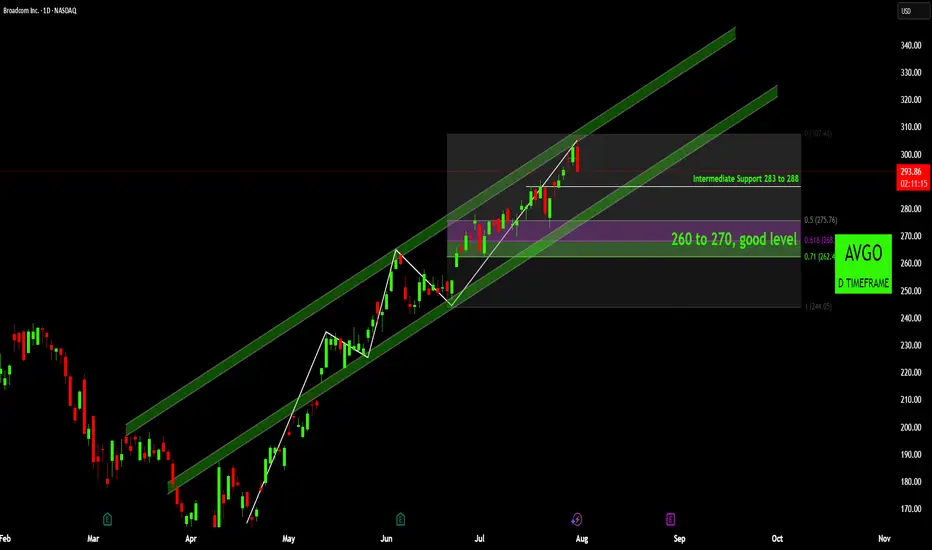
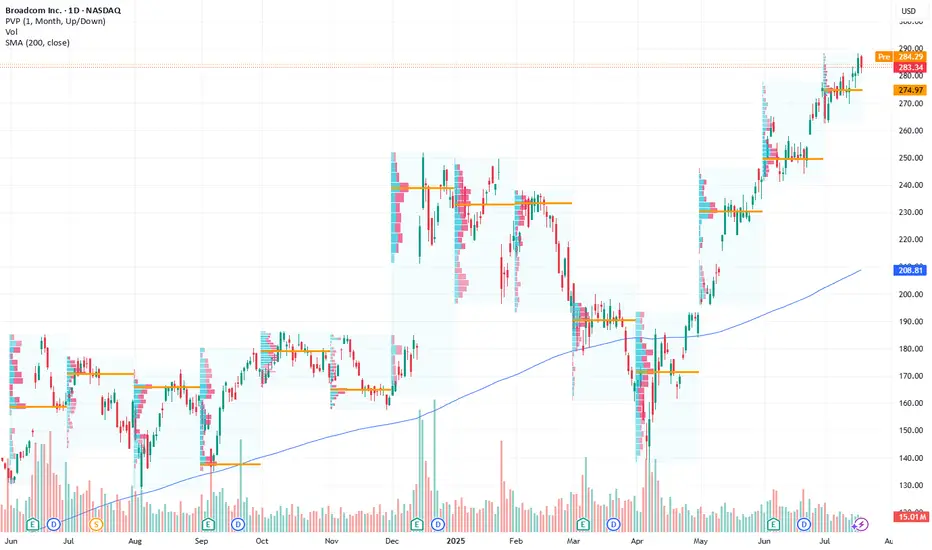
Broadcom (AVGO): Is This the Dip You've Been Waiting For?Broadcom (AVGO) has been demonstrating a remarkably strong bullish trend since early April, carving out a clear path of higher highs and higher lows. This robust upward momentum is well-defined by a series of ascending channels.
Trend and Channel Dynamics:
Initially, we observed price action mov
Next report date
—
Report period
—
EPS estimate
—
Revenue estimate
—
2.5 USD
5.89 B USD
51.57 B USD
4.61 B
About Broadcom Inc.
Sector
Industry
CEO
Hock E. Tan
Website
Headquarters
Palo Alto
Founded
1961
FIGI
BBG00M6X3FB3
Broadcom Inc. is a global technology company, which designs, develops, and supplies semiconductors and infrastructure software solutions. It operates through the Semiconductor Solutions and Infrastructure Software segments. The Semiconductor Solutions segment refers to product lines and intellectual property licensing. The Infrastructure Software segment relates to mainframe, distributed and cyber security solutions, and the FC SAN business. The company was founded in 1961 and is headquartered in Palo Alto, CA.
Related stocks

Broadcom Middle of Range RisksI like Broadcom if it gets down to $178. Right now it's still floating from the AAPL news. I wouldn't be inclined to sell here, but if looking to buy (like myself) I'd wait in hopes for $178.
Target (Potential Next Support) $302.
Good luck!

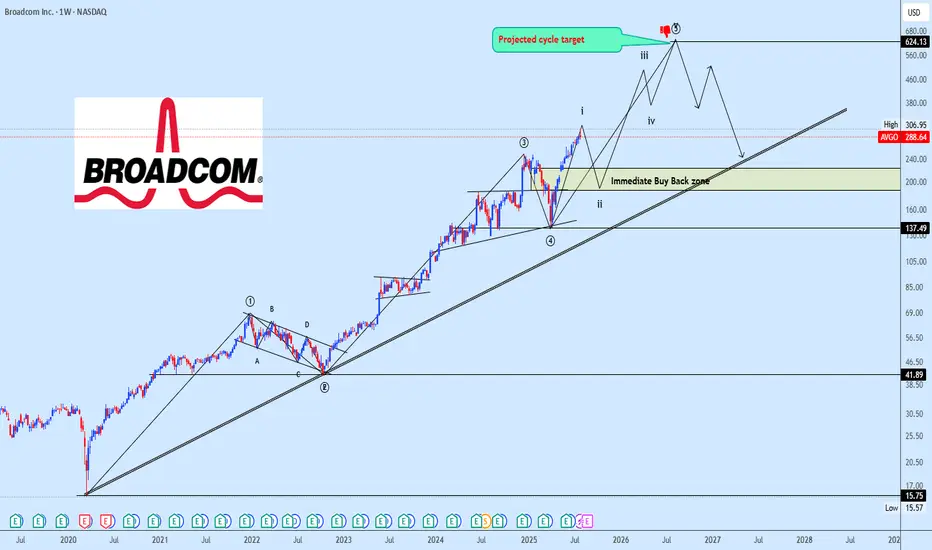
AVGO Bullish Impulse Wave Structure in ProgressAVGO continues its macro advance with a clear 5-wave impulse structure unfolding. The current price action marks the completion of subwave (i) of wave ⑤, setting the stage for a corrective pullback into subwave (ii).
We expect this corrective leg to reach into the 38.2%–50% Fibonacci retracement zo
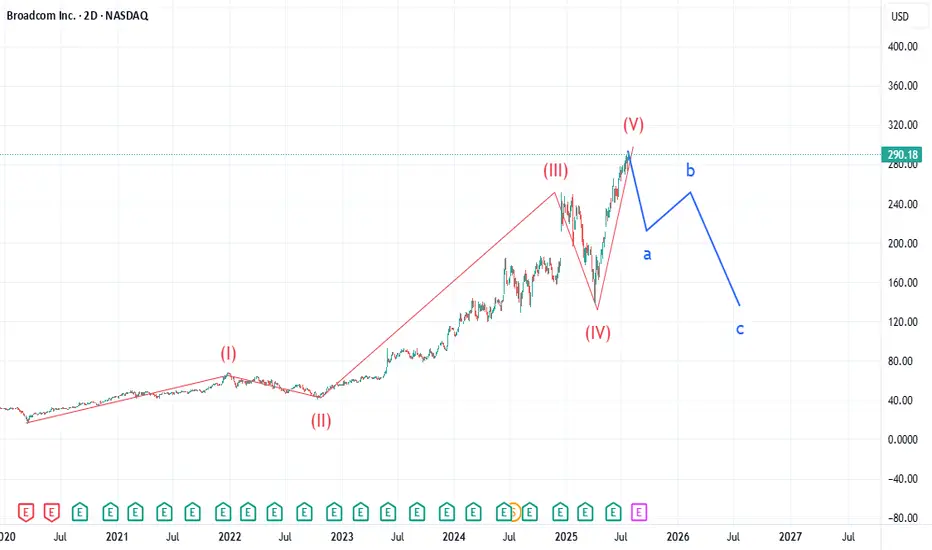
AVGO: Too Many Similarities Market WideLike my chart on BKNG, AVGO is showing an uncanny similarity to Booking.com's chart. Many indices are showing the end of 5 waves in a super cycle dating back to the drop of March 2020. AVGO pt1 is 211. Expecting selling to increase over the next 90 days. Not certain what the catalyst will be, but lo
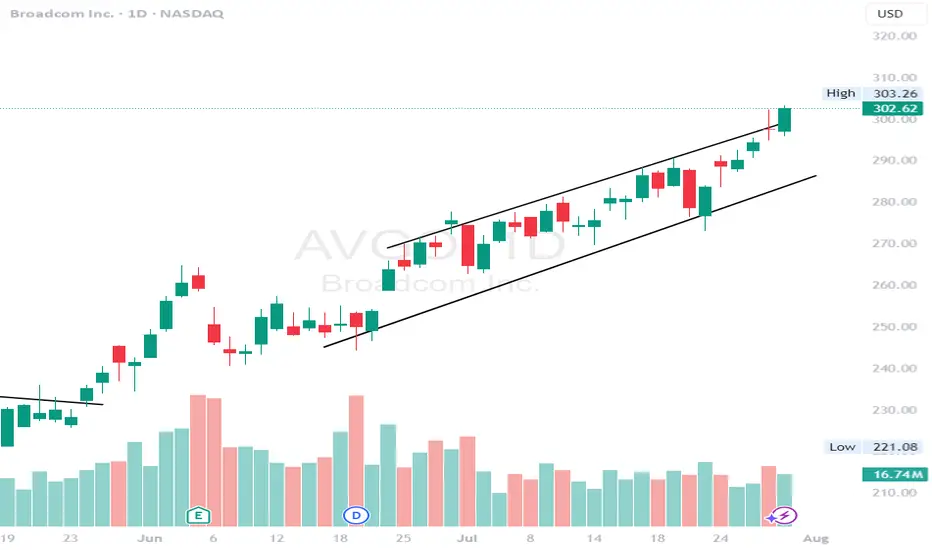
$AVGO - channel breakout on the daily.AVGO - Stock in a channel breakout pattern on the daily time frame. Stock broke and held $300 level. Looking for more upside here towards $315 and $330. Stock is decent on the indicator level.
AVGO ( Broadcom.Inc ) NASDAQ:AVGO - Continuation of movement within the ascending channel + potential for a breakout to new historical highs. 🔍 Rationale:
• After a strong correction in the first quarter of 2025, the price formed a reversal and has been moving in a clear ascending channel since the beginning of May.
• T

Broadcom: Positioned for Long-Term Growth in AI and EnterprisesCurrent Price: $283.34
Direction: LONG
Targets:
- T1 = $292.00
- T2 = $305.00
Stop Levels:
- S1 = $280.00
- S2 = $275.00
**Wisdom of Professional Traders:**
This analysis synthesizes insights from thousands of professional traders and market experts, leveraging collective intelligence to ide
AVGO Long1. Broader Market Structure
1.1 Change of Character (CHoCH)
A clear Change of Character occurred at $290.53, where price broke below a prior higher low. This was a key early signal of a potential bearish reversal, as bullish momentum began to weaken and sellers stepped in with conviction.
1.2 Break

AVGO - LONG Swing Entry Plan NASDAQ:AVGO - LONG Swing Entry Plan
Entry Zone 1: $280.80 – $277.00
→ Open initial position targeting +8% from entry level.
Entry Zone 2: $265.50 – $261.00
→ If price dips further, average down with a second equal-sized entry.
→ New target becomes +8% from the average of Entry 1 and Entry 2.
A

See all ideas
Summarizing what the indicators are suggesting.
Neutral
SellBuy
Strong sellStrong buy
Strong sellSellNeutralBuyStrong buy
Neutral
SellBuy
Strong sellStrong buy
Strong sellSellNeutralBuyStrong buy
Neutral
SellBuy
Strong sellStrong buy
Strong sellSellNeutralBuyStrong buy
An aggregate view of professional's ratings.
Neutral
SellBuy
Strong sellStrong buy
Strong sellSellNeutralBuyStrong buy
Neutral
SellBuy
Strong sellStrong buy
Strong sellSellNeutralBuyStrong buy
Neutral
SellBuy
Strong sellStrong buy
Strong sellSellNeutralBuyStrong buy
Displays a symbol's price movements over previous years to identify recurring trends.
Curated watchlists where 0YXG is featured.


Frequently Asked Questions
The current price of 0YXG is 282.0 USD — it has decreased by −4.19% in the past 24 hours. Watch BROADCOM INC COM USD0.001 stock price performance more closely on the chart.
Depending on the exchange, the stock ticker may vary. For instance, on LSE exchange BROADCOM INC COM USD0.001 stocks are traded under the ticker 0YXG.
0YXG stock has fallen by −2.53% compared to the previous week, the month change is a 6.05% rise, over the last year BROADCOM INC COM USD0.001 has showed a 74.04% increase.
We've gathered analysts' opinions on BROADCOM INC COM USD0.001 future price: according to them, 0YXG price has a max estimate of 400.00 USD and a min estimate of 210.00 USD. Watch 0YXG chart and read a more detailed BROADCOM INC COM USD0.001 stock forecast: see what analysts think of BROADCOM INC COM USD0.001 and suggest that you do with its stocks.
0YXG reached its all-time high on Jul 31, 2025 with the price of 307.0 USD, and its all-time low was 17.5 USD and was reached on Mar 18, 2020. View more price dynamics on 0YXG chart.
See other stocks reaching their highest and lowest prices.
See other stocks reaching their highest and lowest prices.
0YXG stock is 4.56% volatile and has beta coefficient of 2.33. Track BROADCOM INC COM USD0.001 stock price on the chart and check out the list of the most volatile stocks — is BROADCOM INC COM USD0.001 there?
Today BROADCOM INC COM USD0.001 has the market capitalization of 1.36 T, it has increased by 1.96% over the last week.
Yes, you can track BROADCOM INC COM USD0.001 financials in yearly and quarterly reports right on TradingView.
BROADCOM INC COM USD0.001 is going to release the next earnings report on Aug 28, 2025. Keep track of upcoming events with our Earnings Calendar.
0YXG earnings for the last quarter are 1.58 USD per share, whereas the estimation was 1.57 USD resulting in a 0.69% surprise. The estimated earnings for the next quarter are 1.66 USD per share. See more details about BROADCOM INC COM USD0.001 earnings.
BROADCOM INC COM USD0.001 revenue for the last quarter amounts to 15.00 B USD, despite the estimated figure of 14.96 B USD. In the next quarter, revenue is expected to reach 15.82 B USD.
0YXG net income for the last quarter is 4.96 B USD, while the quarter before that showed 5.50 B USD of net income which accounts for −9.78% change. Track more BROADCOM INC COM USD0.001 financial stats to get the full picture.
Yes, 0YXG dividends are paid quarterly. The last dividend per share was 0.59 USD. As of today, Dividend Yield (TTM)% is 0.80%. Tracking BROADCOM INC COM USD0.001 dividends might help you take more informed decisions.
BROADCOM INC COM USD0.001 dividend yield was 1.25% in 2024, and payout ratio reached 170.61%. The year before the numbers were 2.19% and 55.79% correspondingly. See high-dividend stocks and find more opportunities for your portfolio.
As of Aug 3, 2025, the company has 37 K employees. See our rating of the largest employees — is BROADCOM INC COM USD0.001 on this list?
EBITDA measures a company's operating performance, its growth signifies an improvement in the efficiency of a company. BROADCOM INC COM USD0.001 EBITDA is 31.09 B USD, and current EBITDA margin is 48.98%. See more stats in BROADCOM INC COM USD0.001 financial statements.
Like other stocks, 0YXG shares are traded on stock exchanges, e.g. Nasdaq, Nyse, Euronext, and the easiest way to buy them is through an online stock broker. To do this, you need to open an account and follow a broker's procedures, then start trading. You can trade BROADCOM INC COM USD0.001 stock right from TradingView charts — choose your broker and connect to your account.
Investing in stocks requires a comprehensive research: you should carefully study all the available data, e.g. company's financials, related news, and its technical analysis. So BROADCOM INC COM USD0.001 technincal analysis shows the neutral today, and its 1 week rating is buy. Since market conditions are prone to changes, it's worth looking a bit further into the future — according to the 1 month rating BROADCOM INC COM USD0.001 stock shows the buy signal. See more of BROADCOM INC COM USD0.001 technicals for a more comprehensive analysis.
If you're still not sure, try looking for inspiration in our curated watchlists.
If you're still not sure, try looking for inspiration in our curated watchlists.