@VillageTraderZA - Anglo Retests resistanceAnglo retests the baseline of the ascending triangle breakout. Closing above the 200 EMA on Friday with a doji candlestick. Proving a good buy opportunity with a tight stop loss just below the 200 day EMA around R573.
AAL trade ideas

Anglo AmericanPennant break on the daily chart targets 700.
,,,,,,,,,,,,,,,,,,,,,,,,,,,,,,,,,,,,,,,,,,,,,,,,,,,,,,,,

An RSI based on Constance Brown's workCreated for ZmDm, this is a an RSI that plots four zones throughout: the Bear and Bull buy zones, and the Bear and Bull sell zones. Brown suggests the important moves are the ones that happen closer to the midline (in any oscillator), hence the four zones.
You would use this alongside other indicators.

Market Neutral: Long AGL-Short KIO Idea Is Now +22%The last local stock pair that I looked at was Long AGL/Short KIO on 21 July (see attached). That pair is now +22% over the 7-week period.
For more on market neutral strategies, get in touch today.

AG Capital -Storm trading Morning Call 8 septemberWe give a quick recap of markets overnight and the previous day and insights into the day ahead with a few trade ideas on the day. Ideas are strictly NOT INVESTMENT ADVICE.

AG Capital -Storm trading Morning Call 7 September 2021We give a quick recap of markets overnight and the previous day and insights into the day ahead with a few trade ideas on the day. Ideas are strictly NOT INVESTMENT ADVICE.

Update: Long AGL/Short KIO; +10% Follow-ThroughThe ratio price moved higher immediately from day of publication as opposed to the lower-then-higher price action expectation.
Nonetheless, a +10% gain on the pair since 21 July.
Original idea attached.
For more insights and opportunities, get in touch with me today.

Anglo American Plc - Cash Flow, Generated. In this week's main report, we split AGL into a 'day plan' (Monday 12/07) and a 'swing plan'. This post relates to the day plan, which was outlined as follows:
"It’s possible that the price retraces to the mid-point of the prior day candle, which is in line with the 8-day EMA. Look for support here (57800c/58100c) to buy up to the 59100/59300c area."
Today's low was seen at 57788c, while during the last hour of trade, the share is printing 59398c (exceeding intraday target).
As a 'day play', this would have been a decent cash flow generator around a core long or short position.
I also highlighted Northam Platinum, with both a swing and day plan, however the 'day' level did not trigger.
Get in touch today to get the inside scoop around what's 'in play'.

AGL UpswingJSE:AGL seems to be making an upswing at the moment. It recently formed a higher low and now with the EMAs crossing which was preceded by signals from the Stochastic as well as the MACD - I think we could see the upward momentum continue possibly all the way up to the resistance at around the 63500 area.


JSE:AGL Pullback Gaining MomentumAs indicated previously - see post below - Anglo American is ready for a pullback and is now gaining momentum. Still looking for a test of R400 to determine what is next.

AGL - Bull flag in the makingAGL has made a decent pullback after making all time highs. The trend is still intact and R600 has shown signs of support. A close above R620 triggers the long idea. Full target at R680 and stop loss a close below R600.

JSE:AGL Anglo American Time to Let it GoWe were looking at a markup in Anglo American - see post below - but with declining interest in the stock, divergence on the volume RSI and break of the 50 Day SMA I think this stock is ready for a pullback probably to R400.

BHP Group vs Anglo American PlcBHP vs AGL - two shares and comments I'm publishing from a discussion we were having yesterday.
The following comments are in the context of a long-term portfolio . There are 3 more comparative charts that go along with this discussion, but for the sake of simplicity (and clients), I'll keep it at the main chart.
On a relative basis, AGL is nearing long term technical resistance vs BHP, that being the downward trend line extending back to June 2003 and the swing high of January 2007.
Also, from the resource sector low of January-2016, AGL has outperformed BHP by around 340%.
Reviewing the individual performance, the following is noted:
BHP's peak prior to the Jan-2016 lows occurred in August 2014, which I am using as a reference point. From then to Jan-2016, BHP declined by ~63%, while AGL fell by ~82%.
While both declines were similar in % terms, AGL has recovered by ~1280%, while BHP has only recovered by ~268% from the January 2016 lows.
Based on the chart which highlights the pending resistance, the technical case would look to buy BHP and sell AGL as a catch-up investment/trade within a long-term portfolio.
*Know Your Time Horizon and Manage Your Own Risk*

AGL - Upward ChannelJSE:AGL has been trading in an upward channel and has recently bounced off the top for the 3rd time. I think we could see a move downwards to the bottom of the channel from here. The 60000 level is a potential target before either bouncing up or breaking out of the channel.

AGL ascending triangleAGL one of the star performers has broken out of an ascending triangle. TP R735

AGL: higher highs and higher lows...MACD bullish crossover on the daily time interval supports a bullish.
RSI might be overbought, that is a concern.
Higher highs and higher lows remain of interest.
ABove 60448 a bullish trend remains applicable.

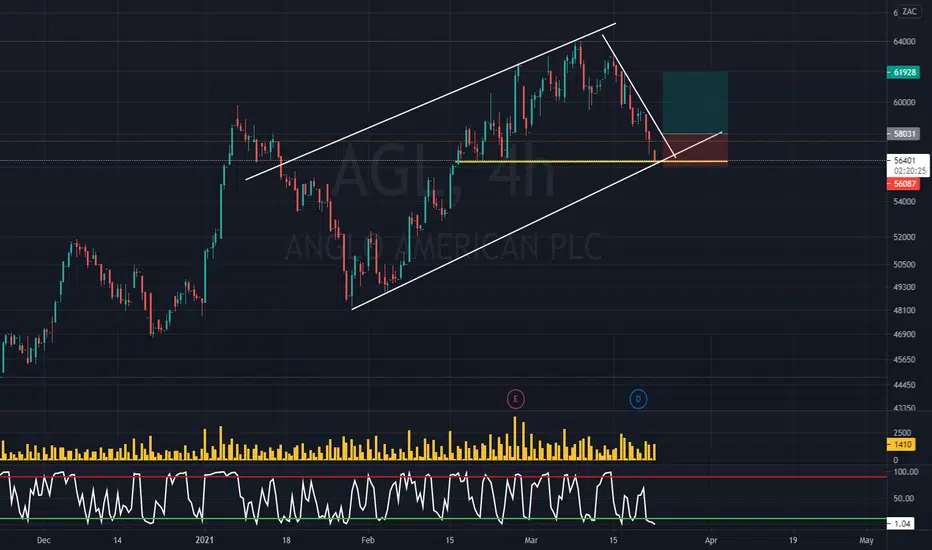
AGL 4hr testing bottom trendlineclosing above 580 will initiate a long signal for AGL on the 4hr chart
Risk Reward - 1:2
AGL - Short if it breaks through support levelJSE:AGL is currently at a support level from January 2021. If it breaks through this support level, we could possibly see a move down towards the 49000 support level.

AGL - Upward Momentum BuildingAfter a nice downward trade, JSE:AGL seems to be reversing for an upward move. Our momentum indicators, the MACD, Stochastic and 3 & 15 EMA's are all confirming this possible move.
I will be looking at 60000 resistance level for a target.


JSE:AGL Anglo American MarkupAfter some consolidation that started in April 2019, there has been a spring, break out of the trading range, backup and now the markup phase. After a pullback, the stock is again being pushed higher to likely new highs.

AGL Ultra Short Term Buy Coming into the week of 11-15 Jan, the name (and peers) ranked as 'near overbought'.
As at yesterday's close, the lower time frame suggested 'near oversold'. In addition, the price trades on it's 50% FIB retracement, and is currently reclaiming yesterday's lows, following a print below it at the open this morning.
This looks like an ultra short term buy. price at 49160 as I type. SL: 48400c.
