BMN trade ideas
"BMN" Could Bushveld Be Pushing Out Of Resistance?First of all, I am new to technicals & have only been investing & trading for a year now so please don't run with this its just my inexperienced opinion please do your own research.
I have been swing trading Bushveld for a few months now and see the price action gap down looks to be getting smaller I'm looking for a quick pullback and hoping for a push through the 15 resistance level it has hit twice now from looking & the chart I'm looking at a bullish triangle pattern only time will tell but I'm looking at going long every soon.
Let me know your thoughts & feedback this is my first idea so constructive criticism is always welcome.
Bushveld Price peaked at $28.8 on November 29 2018... it is now $8.50
Would like to see it jump the downward trend.
Vanadium is used in aerospace, military defense, large-scale energy storage, and steel-strengthening agents.
China controls 60% of the global vanadium supply.
US imports 100% of its vanadium.
China’s vanadium supply is insufficient to meet its own domestic demand.
With global demand vastly out-stripping supply, the fundamentals are bullish for vanadium in both the short and long terms.
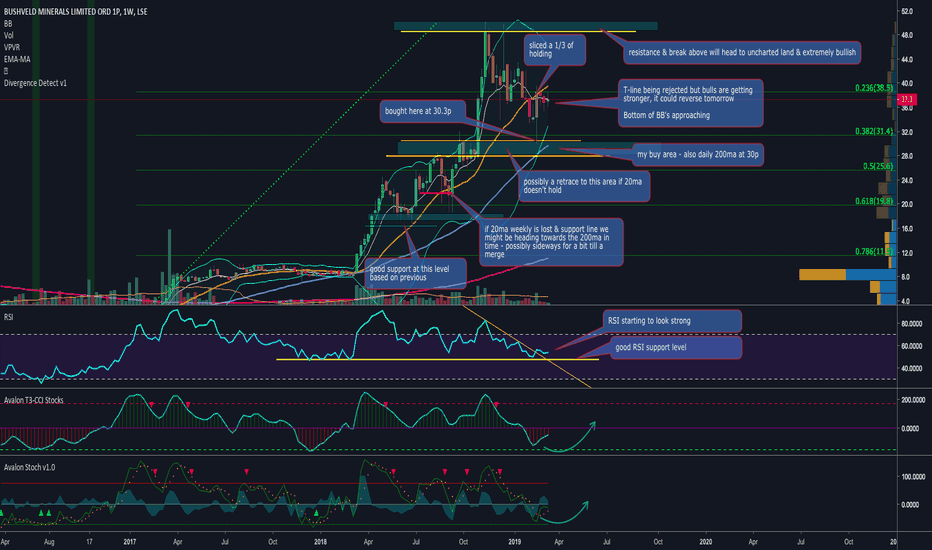
Possible retrace to 50ma before next leg UPDATEHaving sliced 1/3 at 38.5 after buying at 30.3p I have now sold rest at 34p to protect profits.
Possibly a retrace to 30p again where 50ma lies, if it not then I will evaluate the chart for another entry at some point.
I generally don't chase the price if I don't get it.
A solid company producing vanadium.
Weekly T-line close to break / RSI stronger #mfchartRSI trend line stronger and towards end of day a few buys kicking in and almost closing above t-line, tomorrow might be the day we could end the week above it.
Bought at 30.3p and sliced 1/3 at 38.5p and holding the rest for bigger %
will add more if we test the support again but bottom of BB's are moving up.
there’s a couple of things expected in Q1 for BMN:
- Brits resource estimate
- Capital allocation framework and dividend policy
Both were reiterated in their latest presentation released a week ago
Big news I’m expecting later in the year:
- JSE listing
- Mokopane mining right
- Brownfield processing acquisition
- Bushveld Energy results from battery test with Eskom and potential contracts for grid level storage
I’m also expecting the vanadium price to move up as the year progresses, there’s a structural supply deficit which isn’t expected to disappear until 2023 or so.
My buy zone 28p-30p - 50ma weekly & 200ma daily supportA great company with 0 debt & making solid revenue with Vanadium
Scaling in as we speak with 1st tranche today and if I get 28p I will add further.
Many annotations are from following chart for months.
Please do your own research.
Solid future investment.
Bushveld Minerals - Support level and buying opportunityThe fundamentals of BMN are extremely strong, with high cash generation, ambitious expansion plans underway and H1 2018 financial results due in September. For more information on fundamentals, visit www.thebushveldperspective.com .
From a technical standpoint, we've seen a recent retrace from highs (caused by a reduction in annual production guidance) which bounced off the 0.618 fib retrace level. The price came back up to the 0.786 fib line, which has previously acted as resistance for the stock with the RSI above 70. This also brings the price to the bottom of the channel defined by lows in the uptrend over the past few months.
Given that the RSI is currently down at 40 and very close to a potential divergence support line, I see the 0.786 fib line as a key level - a finish over this (23.9p) could see a run higher into the mid-high 30s over the coming weeks .
BMN Long EWTBUSHVELD MINERALS
• BMN trading near all time highs
• Both Wave 3 and Wave iii are in motion
• Momentum studies positive
Currently trading near all time highs, Bushveld Minerals (BMN) still has room to continue higher. A rally begun with a gap after a year long consolidation period. With a high at 24.50 reached in May, BMN saw a correction back to the 17.10 level - finding support. The Elliott Wave 1 subdivided into a Minute impulse wave. Wave iv retraced 38.2% of the Wave iii advance, stalling inline with the 17.10 support level. Wave iii and Wave v tops saw bearish divergence, warning that a corrective phase was near. Wace C saw bullish divergence, again, giving a potential warning that the correction is over, and a new impulse move was about to occur.
More recently however, BMN has had a solid advance, breaking above a psychological level of 20.00, and breaking above the May high of 24.50. It has given back some of its gains however, retracing and holding the 21.70 level. This has formed a new wave i and ii count equalling Wave 3 of higher degree.
With BMN just hovering below 27.00 it has much more room to rally as it is in Wave 3 of both degrees. Though not always the longest wave, it has potential to move to 32.00. This level is the point at which Wave 1 = Wave 3. The RSI favours the bullish picture and reinforces the potential for a move higher. A possible retracement to the uptrend line is also possible and would be a great opportunity to go Long. Longs can also be entered at the break above 27.00 if a more conservative approach is preffered.


