Australian dollar eyes RBA minutesThe Australian dollar is unchanged at the time of writing, trading at 0.6692 in the European session.
There are no economic releases out of the US or Australia today, which should translate into a quiet day for AUD/USD.
The Aussie is coming off an excellent week, gaining 1.36% and hitting its highest level since January. In the month of May, AUD/USD has surged 3.4%.
Tuesday will be busier, with the Reserve Bank of Australia releasing the minutes of the policy meeting earlier this month. At that meeting, there were no surprises as the RBA held the cash rate at 4.35% for a fourth straight time.
Notably, the central bank discussed the possibility of a rate hike at the meeting, which was not the case at the March meeting. This was likely a response to first-quarter CPI, which was slightly higher than expected. CPI fell from 4.1% to 3.6%, missing the forecast of 3.5%. Service inflation remains sticky, which means that CPI is expected to continue to ease, but slowly.
RBA policy makers are concerned that the path to the 2% inflation target will be bumpy and are hesitant to start lowering rates until they see evidence of sustainable price stability. The fact that a rate hike is on the table, albeit an unlikely scenario, indicates that the RBA remains cautious and somewhat hawkish, and a rate cut will have to wait until inflation shows a substantial decline.
Australia will also release Westpac Consumer Sentiment on Tuesday. The index has declined two straight times and remains in negative territory as consumers remain surly about high interest rates and the high cost of living. The May release is expected to show an improvement, with a market estimate of a 0.9% gain.
AUD/USD has support at 0.6681 and 0.6662
0.6714 and 0.6733 are the next resistance lines
CPI trade ideas

CapitaCapita once £8, now £0.37. Unloved and forgotten for a long time. Balance sheet now repaired. Strong interest shown recently with good volume. Worth buying, with patience.

CPI - Reversal play with strong fundamentalsTechnical Analysis
Jan to April 2022 CPI entered a phase where it was oversold as shown by the 1M William %R entering below the -80 level. Signaling a potential mean reversion play or reversal play.
Since 25 April the stock has been moving upwards and is now on the verge of confirming a reversal play on the 1Wk chart but with William %R on the 1Wk chart being above -20 I expect the stock to consolidate between $31.44 and $24.60 prior to deciding its 1M and 1Wk direction.
A break below $24.60 the 1Wk continuation play would be triggered as it would show signs of low buying momentum/demand etc. and I expect the bottom of $20 to be tested again.
A break above $31.44 would signify high demand/ volume and potential shift in momentum.
Price Targets
If BUY triggered I expect an initial target of $44-$56 (+36% to +78%) with further upside expected if momentum shifts significantly in the markets or we see news/catalysts pushing price past $56.
If SELL triggered I expect an initial price target of $19-$21 (+14% to 22%) with further downside expected if it breaks support below.
Financials & Quality Screen
EV/EBIT: 3.86
ROIC: 25.02%
Piotroski F Score: 6
Excellent sustainable growth rate: 316

Capita: 5R Long SetupCapita - Short Term - We look to Buy at 33.70 (stop at 31.08)
We look to buy dips. We are trading at oversold extremes. Price action moved lower but found support at 34.00. We look for a temporary move higher. A higher correction is expected. Risk/reward is ample to call a buy trade.
Our profit targets will be 48.89 and 55.00
Resistance: 45.00 / 50.00 / 55.00
Support: 34.00 / 31.00 / 25.00
Disclaimer – Saxo Bank Group. Please be reminded – you alone are responsible for your trading – both gains and losses. There is a very high degree of risk involved in trading. The technical analysis, like any and all indicators, strategies, columns, articles and other features accessible on/though this site (including those from Signal Centre) are for informational purposes only and should not be construed as investment advice by you. Such technical analysis are believed to be obtained from sources believed to be reliable, but not warrant their respective completeness or accuracy, or warrant any results from the use of the information. Your use of the technical analysis, as would also your use of any and all mentioned indicators, strategies, columns, articles and all other features, is entirely at your own risk and it is your sole responsibility to evaluate the accuracy, completeness and usefulness (including suitability) of the information. You should assess the risk of any trade with your financial adviser and make your own independent decision(s) regarding any tradable products which may be the subject matter of the technical analysis or any of the said indicators, strategies, columns, articles and all other features.
Please also be reminded that if despite the above, any of the said technical analysis (or any of the said indicators, strategies, columns, articles and other features accessible on/through this site) is found to be advisory or a recommendation; and not merely informational in nature, the same is in any event provided with the intention of being for general circulation and availability only. As such it is not intended to and does not form part of any offer or recommendation directed at you specifically, or have any regard to the investment objectives, financial situation or needs of yourself or any other specific person. Before committing to a trade or investment therefore, please seek advice from a financial or other professional adviser regarding the suitability of the product for you and (where available) read the relevant product offer/description documents, including the risk disclosures. If you do not wish to seek such financial advice, please still exercise your mind and consider carefully whether the product is suitable for you because you alone remain responsible for your trading – both gains and losses.

CPI - Cup & Handle?Not involved yet - break above channel needs to hold / consolidate - however if it does, it could be a great move up.

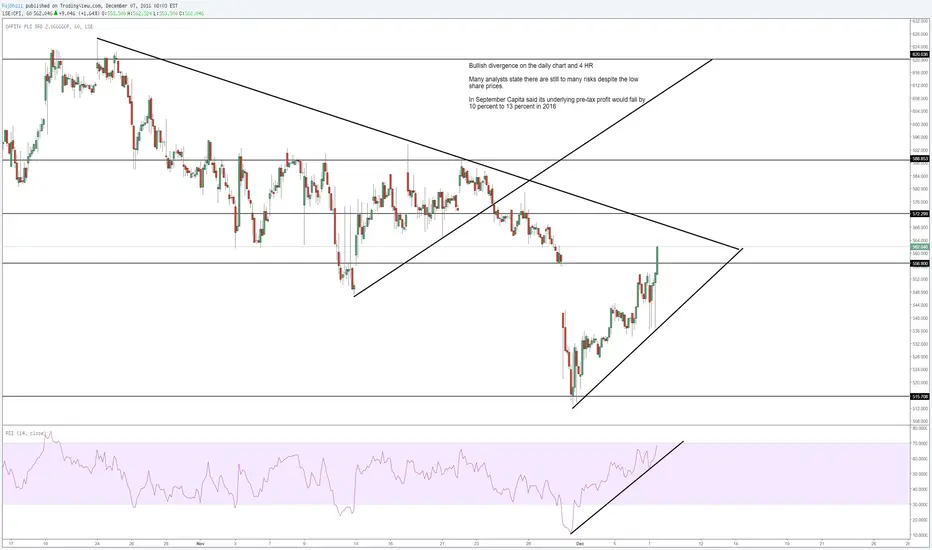
CAPITA PLC - Regular bullish divergence*Investment opportunity - low risk*
On the above monthly chart above price action has corrected 95% since mid-2015 with following oversold condition (dark orange column). There now exists a number of technical indicators that make Capita an exciting stock to add to your portfolio. Lets go through them:
1) Regular bullish divergence. Price action makes a lower low while the oscillators print a higher high. The 2-month chart below provides a clearer picture of this bullish divergence.
2) Volume increase. A large capitulation candle formed during the month of March 2020, ever since buyers have been accumulating. Together with point (1) above this is very bullish.
3) Monthly Bullish engulfing candle. Indicated above with the blue ‘BE’ marker, the Bullish engulfing candle on the monthly chart is not to be ignored. A very powerful indication of an imminent trend reversal.
A buy from 32 is perfect
1st target, 75
2-month chart


CPI - Monthly analysis CPI has been on a long term downtrend since 2015.
Price is testing the ATL (All time Low) support and descending channel resistance.
RSI is printing a bullish divergence signal.
Price action is printing a double bottom trend reversal pattern.
Bullish ⬆️ - breakout above the double bottom neckline resistance + descending channel resistance.
Target 🎯 - resistance levels.
Setup invalidation ❌ - breakdown below the ATL (All Time Low) support.


Sell model in 38Failed to take the high
breaking down into previous area of demand at 40.
Betting on a stop sweep and going long by 31st December


CAPITA - BUY (long term) Capita's shares took a tumble today after earnings revealed;
The Bad;
£28.5mln for the first 6 months of the year (vs a £31.2mln profit for first 6months of 2019)
-9% revenue
There is also a concern on the groups ability to handle it's debt obligations (which the above has reinforced)
However;
Shares are already down 80% since covid
Capita are on course to sell their Education Software Solutions (ESS) business for as much as £500 million - which will strengthen the balance sheet significantly
Dig a little deeper into the earnings and a £42.8mln hit for untaken holiday is shown- clearly a short term covid impact
Investors have ignored the £355 million of contracts for the London traffic charging schemes awarded to the group last week
Rewind 2 years earlier - Capita had a few scandals with government contracts (army recruitment probably the largest) - a new management team has taken over and Capita has now won £80 million of contracts to help various government departments deal with the impact of the pandemic - the CEO acknowledged this renewed faith in Capita from the government "the government now regards us as a reliable, committed, strategic supplier, and that was confirmed to by a senior civil servant in the last two months"
Costs within the group look set to fall (which is of extra significance due to Capita's shift to lower margin operations) - this is evidenced by the decision not to renew leases on 25 of its 250 offices as the group look to make working from home more permanent

Supply and Demand zones CPILSE:CPI
I would wait for a pullback to one of the two supply zones and go bullish, with a entry where the yellow lines


Capita up to 80% return Capita as a business has some questionable fundamentals, however, these are mostly due to their restructuring debts.
They have recently taken on a contract with Google & Microsoft and with their restructuring plans now coming to the fore, they are primed to push higher being undervalued at present.
Capita has already broken resistance which sat around .43 and gained 20%+ on Friday, today's gain were around 14% until a sell off.
I would be taking profits up to .70 but can see this running to .80 in the next month.

CPI BUY OR LONG TARGET UP TO $60 (Investing long term)The European economy is recovering, with the consensus of new stimulus packages, trading big volum and Stock pattern showing that this is a good time to buy vs many stocks.
CPI pattern : Triangle Symmetrical
Buy : $38-$39
TARGET : $58 (+-2)
STOP LOSS : $36
Wish you good deals!

Capita - LSE - triangle Capita - LSE - triangle and broken down - It's stock related to triangle pattern break out and under performer.
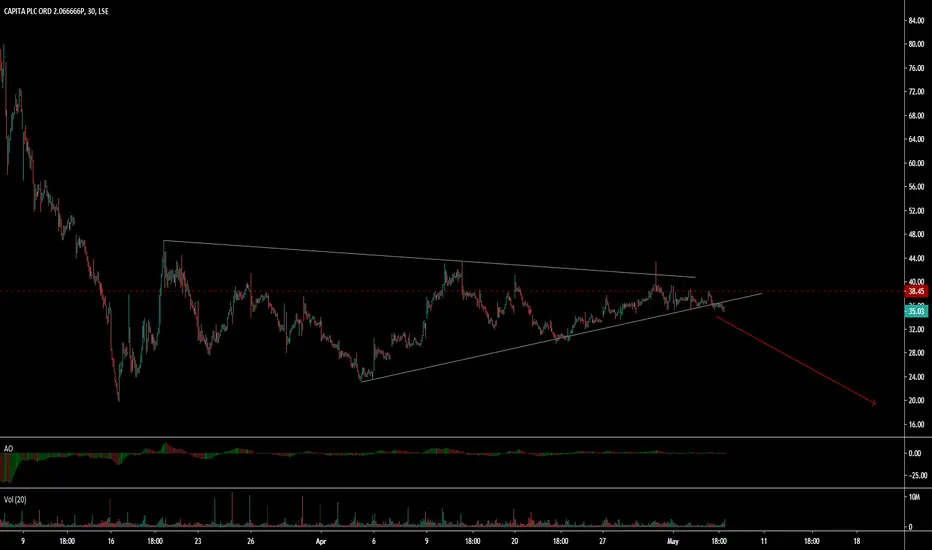
CPI (Capit - LSE) TriangleCPI (Capit - LSE) has made triangle after severe drop. It is likely that it made a new low or trying to touching it after breaking triangle downside. watch closely to break the level.

Capita PLC ShortAwaiting results, this debt ridden equity had links with Carillion. Recent results a profit warning was given and chart wise this equity looks like it'll be the next decent size UK equity to do what Carillion did.
First Target 120p
100p in extension
Then 80p after that.