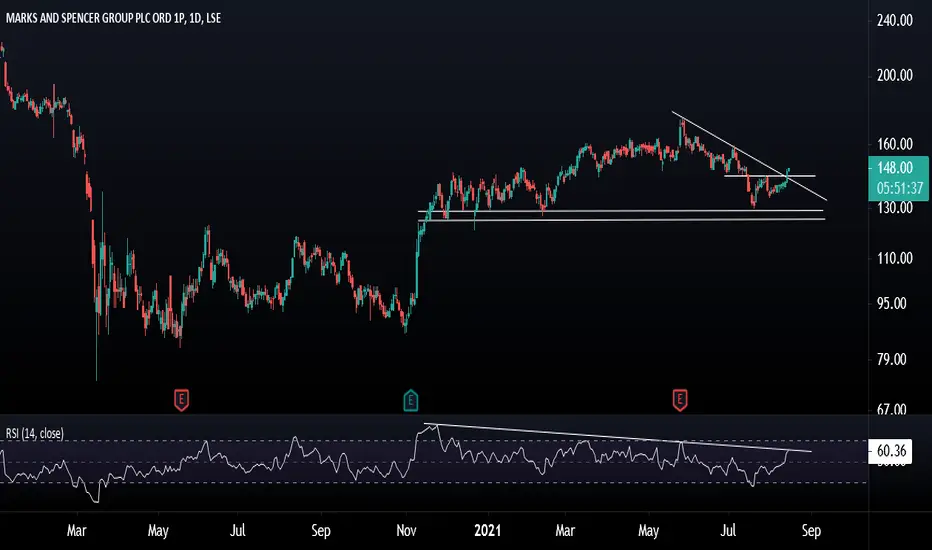
Breakout by Marks & SpencerDouble bottom formed from May 19.
Breakout Nov 23
Retest Feb 24 and now broken out to the upside in May
Appears bullish to me but do your own research and decide on your own trades. This in NOT a recommendation.
MKS trade ideas

Marks & Spencer Gap PLC - LSE - Making a bounce!!we've got Marks and Spencer bouncing back from its recent lows - looks like a fantastic chance to leap in for a buy trade.

2 Retail Stocks to WatchMarks & Spencer (MKS)
Financials:
Marks & Spencer reported strong growth in both its Food and Clothing & Home businesses for the first 19 weeks of the financial year. Food sales increased by over 11%, driven by price changes, while Clothing & Home sales grew by more than 6%, primarily due to in-store growth. Despite economic uncertainties, the company expects significant improvements in full-year profit growth and half-year results compared to previous expectations of modest revenue growth.
Technical View:
Marks & Spencer’s share price has been locked in a powerful uptrend since the turn of the year. Recent price action has seen the shares break out from a wedge pattern and retest trend highs. We are now seeing prices consolidate at trend highs within a series of small candles. This form of high and tight consolidation signals a reluctance to pull back, which suggests that the shares are being accumulated ahead of a potential move higher.
MKS Daily Candle Chart
Next (NXT)
Financials:
Next's half-year sales grew 5.4% to £2.6 billion, benefiting from higher wages and warm weather in late spring and early summer. Pre-tax profit rose 4.8% to £419.8 million, driven by increased sales and higher full-price sales of their own-brand products. They improved free cash flow to £438.1 million and reduced net debt to £1.7 billion. Full-year profit guidance was raised to £875 million. Next completed £167 million in share buybacks, plans to spend £52 million more, and announced an interim dividend of 66p per share.
Technical View
Next’s uptrend is decidedly less pretty than Marks & Spencer’s, but we have seen prices carve out a rising series of higher swing lows. This has created a steepening trendline fan which suggests underlying price momentum is increasing. Recent price action has seen the shares pull back to a key area of trend support created by the broken summer swing highs. Should Next’s uptrend continue, we would expect these broken summer swing highs to provide support moving forward.
NXT Daily Candle Chart
Risk management
It’s worth noting that despite the robust high street presence of both Marks & Spencer and Next, rising inflation may impact consumer spending. Cost-saving measures from both businesses may not fully offset increased costs, potentially leading to higher prices.
Marks & Spencer are set to release half year earnings on 8th November 2023.
Next are set to release Q3 earnings on 1st November 2023.
Disclaimer: This is for information and learning purposes only. The information provided does not constitute investment advice nor take into account the individual financial circumstances or objectives of any investor. Any information that may be provided relating to past performance is not a reliable indicator of future results or performance.

MKS weekly time frame analysisMKS has created a higher low on the weekly time frame. It's a great confirmation of the uptrend after such a brutal long-term bear trend.
Expecting 100 % move up on weekly so it will take some time but our target would be around 377 $.
However it's not the best entry now as the stop loss would have to be placed below 90 $. So it's not a trading idea with a low risk and high reward setup.
From another hand, if you believe in MKS bullish trend, it may be still a good investment for the next months .

Marks and Spencer Plc. +11% on FY Guidance Raised. Take Profit MKS shares gaining 11-12% this Friday as FY guidance raised. Traders could use advance to book profits into the weekend.
Original idea attached (13/08).

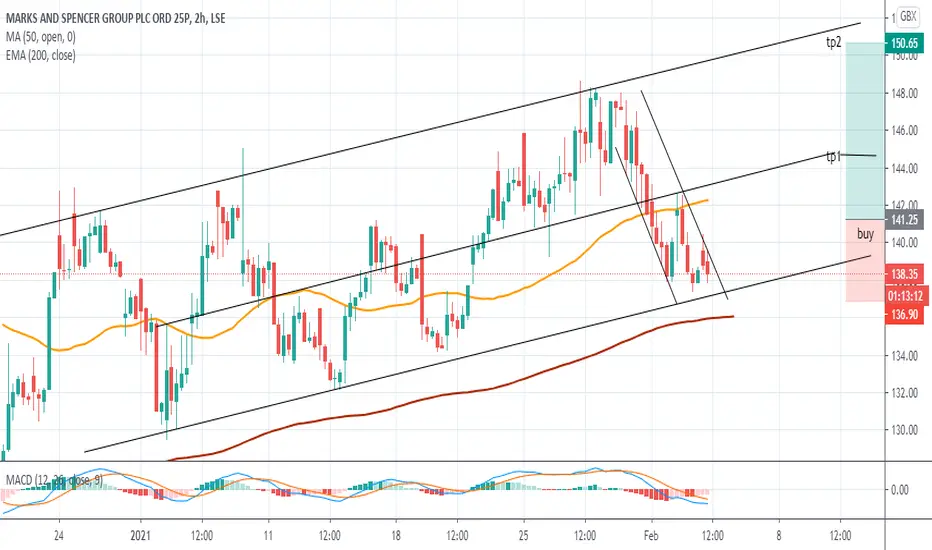
Trade Setup: Buy/Long Marks & Spencer Plc (MKS)Double trend line resistance cleared
Daily 50-EMA and 200-SMA cleared
14-day RSI testing resistance, possible breakthrough
Trade Levels: Buy at current levels, 148.00 or better
Stop: 139.00
Target: 164.00


Marks and sparks undervalued M&S have had an unfortunate ride with the sudden exit of their CEO followed by Covid-19. Nonetheless, we are trading far below its intrinsic value.
As seen we are reaching the final quarter of our descending channel as well as nearing a return to normality from the Corona virus. We can reasonably predict that a break of the channel resistance will take us to our consolidation zone, followed by further upside to the 2000 low of 155.00.

Marks and SpencerBased on my previous Idea, to close the gap with Tesco and Morrisons, M&S should go upward.
Target Price 105.00

Marks & Spencer inverse head and shouldersThe stock is forming an inverse H&S pattern, with divergence on RSI. Good neckline, for final confirmation need an impulsive break. Stop below the shoulder and target the trend line retest.
Good Luck!

M&S 30-40 day trade - my first published IdeaM&S
Been the back bone of UK retail store fronts for a life time, has been in general decline for the last 15 years. It has many of the features of an attractive short:
legacy, disrupted (not disruptive) business model
shrinking revenues
not much evidence of any economic/competitive moat
low margin
capital intensive
financially geared (financial net debt £1.5 BN, excluding lease liabilities)
With T/O of £10BN and £33M of profit trading on a diminishing margin year on year (half'd in last 2 years to 1.46%).
Presently trading at a forward PE ratio of 10.3, which is 17th (out of 34) for its sector, so still over valued compared to it competitors.
It is like an old horse, needs shooting or putting out to pasture, like many UK retail businesses it hasn't adapted to the changes in the high street.
Reason for Idea
Each year for the last 2 years the share price has dropped 2017 9%, 2018 8% over November December due to poor Christmas trading figures.
There is no reason to not expect the same this year and added on top the increasingly worse trading statements each year.
My trade was:
Entry 190p
Limit 160 (15%)
SL 210 (10%, which the share price hasn't hit since July 2019.)


Marks & Spencer : Today's WTF Chart So!!! At Europe close - between 17.25 and 17.35 - someone is buying MKS like crazy....


Marks & Spencer : Clear LONGSomething happening on HIGH Volume !!! From falling wedge Motif the Target Range should be 360-370. In addition a Sornette bubble signal...


The End of Marks & Spencer?I traded this instrument few times and I don´t believe They will grow up. There are more reasons why companies like this have problem now. They need completally rebuild their structure, story and business case. I think they are not necesary wrong company but there is gigant market. Big fish eats small one...
I don´t care how minute timeframes look, I want to have visual outlook where this company will be two years later from now.
Daily short float over 10% is also good reason...
goo.gl
