OCDO trade ideas
Ocado - Looking ripe for buying.Technical
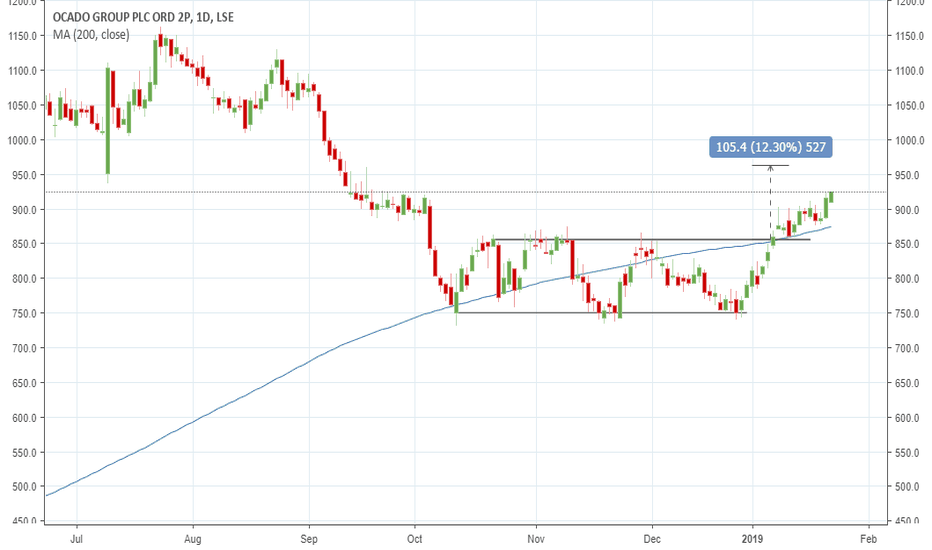
Ocado has had a dramatic rise in price over the past 18 months. The breakout level at 1163p has been retested and has so far been well supported. The shares have been in a consolidation phase for the past few weeks, but some signs are emerging that could put an end to the sideways price action. A move back to and above the previous highs is expected from here.
Fundamentals
The company continues to make strides into technology, which offers potential medium-term growth.
Numis reiterated thier 'Buy' rating on the 10th May 2019 with a price target of 1700p
Ocado has announced a string of deals and recently tied up a joint venture with Marks and Spencer.
Stop 1105p
Target 1500p
Ocado Bouncing Off SupportLast post: June 15th. See chart .
Review: Price was pulling back after being in a nice uptrend.
Update: Price is stuck inside the consolidation zone and currently at the support area.
Conclusion: We need to see a breakout of this consolidation zone before looking at any trading opportunities.
Any comments or questions, do not hesitate to leave them below. Give us the thumbs up if you share our sentiments!
Sublime Trading
Ocado Producing A PullbackLast post: June 11th. See chart .
Review: Price was trending up fast after breaking out of consolidation.
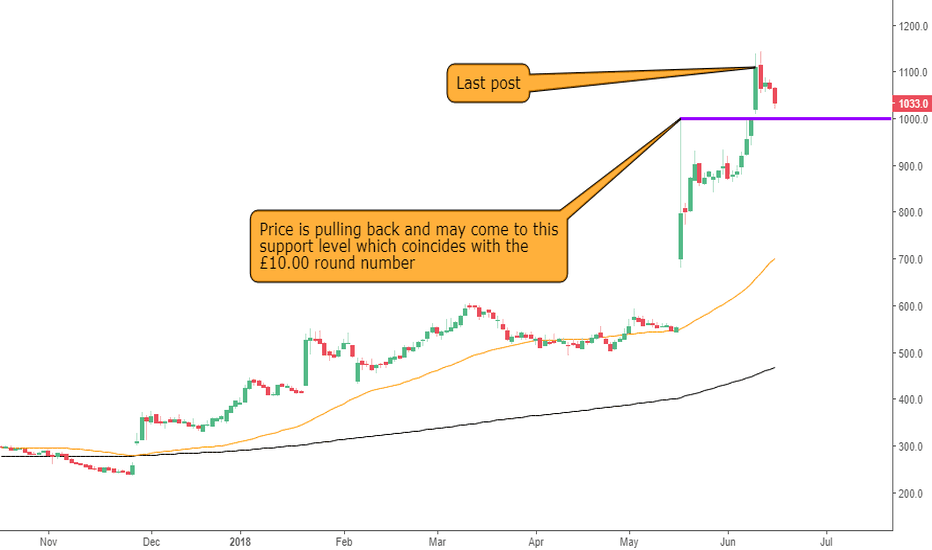
Update: Price is producing a pullback. There is a strong support level underneath which consists of the previous resistance turned support and the £10.00 round number.
Conclusion: If the support level holds then it may present a pullback opportunity, otherwise it may be best to wait for a breakout of the recent high.
Any comments or questions, do not hesitate to leave them below. Give us the thumbs up if you share our sentiments!
Sublime Trading
Ocado Moving Up Fast!This stock is featuring for the first time on our TradingView blogs.
Current setup: Price is experiencing a strong trend and does not look like slowing down.
Conclusion: As price has broken through a previous high on the daily timeframe it is looking good for a long opportunity.
Any comments or questions, do not hesitate to leave them below. Give us the thumbs up if you share our sentiments!
Sublime Trading
Ocado eyes end to price war, daily chart shows bullish symmetric"While the market remains very competitive, there are the first signs of a change in market pricing dynamics coming through," said chief executive Tim Steiner
Daily chart below shows a bullish symmetrical triangle breakout. Share prices has been riding along the support offered by the upper end of the triangle. Let us see if it spikes today...


