S32 trade ideas

S32Testing long term TL support. Should it fail to hold here, next support I see is around 39.80. My stop loss is a close below this level (39.80)
Production numbers came out and looked pretty good, so am happy to go with a long position here.

South32SOUTH32 is one of the great stocks you can have on you're portfolio. Looking at this chart South32 looks to be in a bearish channel forming a bullish flag. South32 is currently trading @R47.45 and I think it may drop to R37-R33 where I believe it can get a great support. South32 could do the opposite if commodity prices could increase.

FUNCHARTS - Gold can be a leading Indicator for South32 (S32)Note: Funcharts are interesting charts I have found that offer a potentially unique perspective on a stock. Sometimes I’ll throw something out there that you might find controversial or wrong headed. If that’s the case your 2 cents worth is most welcome.
South32 (S32) on the ASX has been led by Gold (GLD) by 139 days through history. Go ahead and check out the chart, go back in time and you’ll see that there has been a reasonable correlation between movements in Gold followed by movements in South32. It hasn’t always been 139 days but this has been the highest correlation at 29% of all lag times, if that makes sense.
The current intermarket forecast from Gold suggests a rally through to the 25th July, let’s see.
Incidentally Coffee has provided an inverse correlation, I’ll show you that one another time.
Happy Trading

South32: JSEHOW TO BUY DIPS.
use this strategy every time we had massive momentum in price to catch the falling knife or to ride it.

S32: change in trend direction?Above 4550 supports a bullish trend direction.
Upside price momentum supports the bullish trend.
RSI leaves enough room for further upside potential.
Higher highs and higher lows support the trade idea.
MACD bullish crossover is also applicable.

S32 - long alertThe stochastic, MACD and the 2 EMAs have all crossed, signaling a long position on JSE:S32 .

S32 Profit stopped @ 3.95 1.8R, looking for a test of the LMLThe t/p target was maybe a touch too aggressive considering the previous high in the background. The high was tested and holds for now.
Curious how price will react with the LML, and if the ML set is valid.
There are some alternate entries, which show better RR, and less ‘time in the market’ once the ledge had broken. You don't always have to be first. The first and second Ross Hooks, give possible better trade locations.

S32.ASX_Retracement Trade_LongENTRY: 3.71
SL: 3.36
TP: 4.07
- ADX<20. Would like to be higher.
- RSI>50,RSI<70
- Daily RS +ve
- Daily FFI +ve
- Daily MACD +ve
- Weekly RS +ve
- Weekly FFI +ve
- Weekly MACD +ve
- Retracement since hit high on 14 Oct 2021
- Possible hidden buying on 30 Nov 2021 and followed up with 2 days of above average volume.

$S32 Very nice breakout (aluminium / coal / nickel / zinc)S32 commodities
Alumina
Aluminium
Bauxite
Metallurgical Coal
Lead
Nickel
Manganese
Silver
Zinc

#S32 solved. THre you are. One last ray of bullflag then boom!S32
LONDON version
see the text book rotation of gradients in the bullflag. One left to clear and boom!

S32That is a seriously aggressive bullflag on S32
Yea right inflation is transitory! That's why S32 is into orbit

#S32 320-southCheech and chong-sized bullflag there! Boom.
TIme for a little pullback then away again!


S32 - Next Pullback may give a Buying OpportunityBullish Confirmation Indications
Recent price action has confirmed a reversal by pumping upwards and forming a higher high.
1. Price has formed a higher high
2. It has formed a Golden Cross
3. Recent consolidation at Resistance indicates that the stock price is facing a hard time continuing up
4. The price is at 78.6% Fib Retracement level of $2.45 and @2.60 range, which is also a Resistance Zone
5. OBV suggesting Bullish Volume may be fading
6. I will be confident to buy in the $2.20 - $2.35 region (Buy Zone).
Please note these are my own notes, by no means trading advice. Please do your own research before entering into any trade.

JSE:S32 Bull flag developing (W)JSE:S32 - Multi-month bull flag forming
Confirmation at/above 2856 (Weekly close)
TP - 4082 (Reject the idea if price closes below 2329)

possible inverse H&S on South32possible invese head and shoulders . plan : wait for the market to break out of the neckline (BUYZONE), wait for a testback and close above the neckline

S32Silver meltdown didn't move much the S32 price. Looking to see it break through the Weekly EMA50.


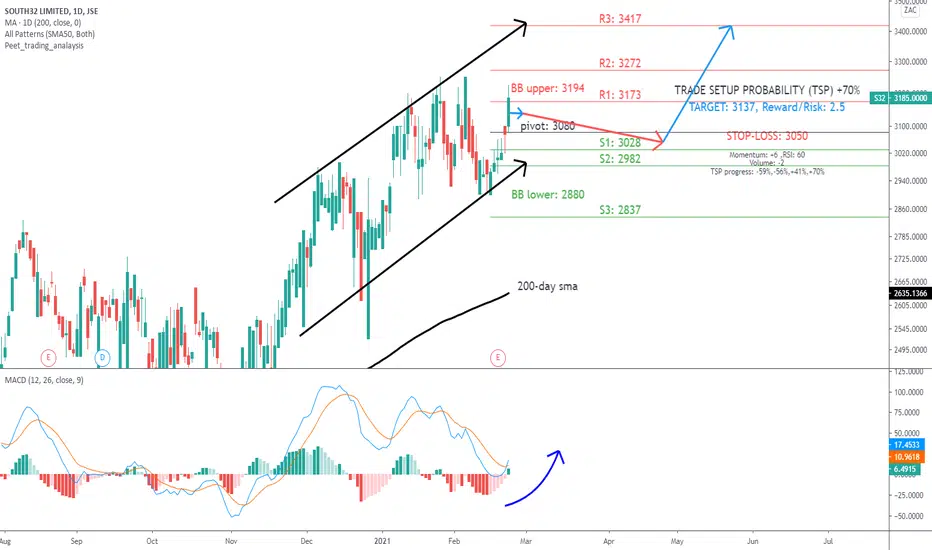
S32 upside forecast target as shown on the chart.Completed pattern and a forecast target as shown on the chart is for educational purposes only.
