Two Dips I'm Watching After The CrashThe market took a beating over the last two weeks or so. Everything except for a few defensive sectors was hit hard. After all the selling, I am looking around and asking: where are some dip buys? I've come up with a list of a few names, but for this chart specifically, I have zoned in on two different companies of industry and size: TSLA and FIVN.
I'll start with Tesla (TSLA):
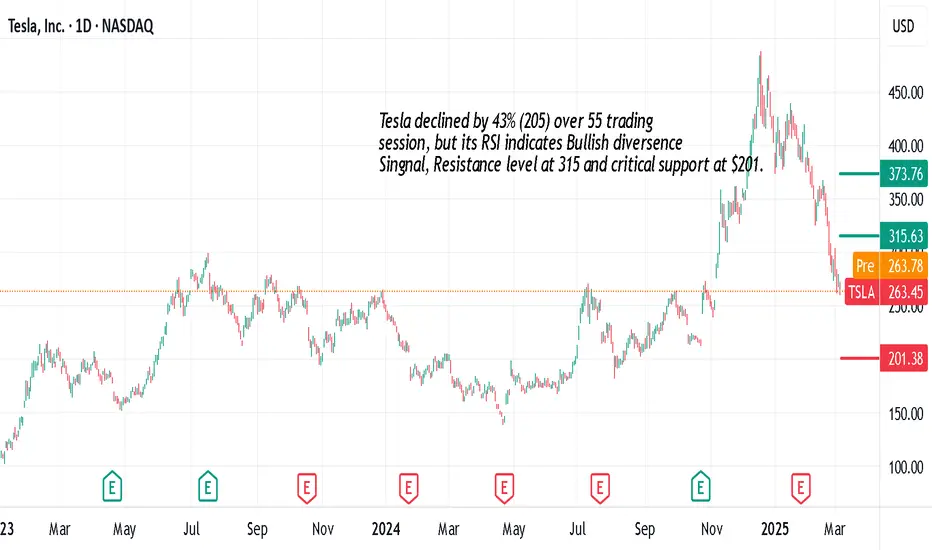
They are down just over 47% from their recent highs. This all transpired over the course of a few months, but it really accelerated over the last few days. I find this drop to be rather remarkable considering Tesla's latest products and upcoming releases. Nevertheless, this comes with challenges, including sales in a country like China and other fundamental factors. Tracking their cash flows and progress toward operational efficiencies is crucial.
Tesla is down 45% in this correction—nearly half of its value gone.
I have never owned NASDAQ:TSLA long-term. I have surely traded and covered it, especially when it first broke out during its epic short squeeze.
Maybe, just maybe, I might have a chance to get in at decent levels.
Now, let's talk about Five9 (FIVN).
Five9 builds and deploys customer management platforms so companies of all sizes can manage their massive user bases. They can use tools across all industries and verticals, and most importantly, it can sync with CRM platforms and AI models to feed it contextual data to make faster decisions.
Just recently, Five9 reported a fairly massive earnings beat, which lead to a spike. Sadly for them, the market crash started and the entire sector tanked. It's now dropped nearly 40% from its highs. At these levels, Five9 could be an interesting rebound candidate either for a swing trade to retrace part of the move.
Quick note: this entire industry has my attention from companies like NICE and others as they are essential to an organization—almost like a staple similar to VZ or T—simply because they power core components of the communication process. You can't just turn off messaging for you and your clients. New-age communications currently fill up my watchlist. I'll make a list soon.
Now, let's see if and when this sell-off ever ends. For now, I am making a list of possible dip buys.
0R0X trade ideas


Tesla at a Crossroads: $257 or a Dive to $242? Alright, Tesla fam—big decision point ahead. Do we hold $257 and drop to $242, or are we about to rip to $280 and start pushing for higher highs? Either way, something big is brewing. How are you playing this?
Kris/Mindbloome Exchange
Trader Smarter Live Better


TSLA - Support and ResitanceI believe NASDAQ:TSLA is entering a key support level here that will lead to a strong bounce back up. TSLA is down nearly 50% from all-time highs and is reaching a support level that had strong resistance for much of the last half of 2024. The RSI is also hanging out below 30 which could also indicate it as a strong candidate for an RSI play as well. I entered into a long position today and will accumulate more while it travels between the $260 and $230 levels. I will also add to this position when the RSI breaks above its 14 SMA. Targets for this trade are the $320 support level and 50 SMA line.

$TSLA worst 4 years are ahead us under president Trump? - What biden couldn't done would be done under $TRUMP.
- NASDAQ:TSLA has always traded at a premium devoid of any fundamentals.
- NASDAQ:TSLA cars are ugly looking cars as compared to NYSE:BYD and $RIVN. It's technology is great but you are basically buying a cheap build quality cars.
- Everyone thought that Trumpn <-> Elon parternship will be great for $TSLA. But my hunch is it will be bad for NASDAQ:TSLA shareholders. Elon's association with Trump will drag the NASDAQ:TSLA shares down and always in the limelight.
- Most elite investors are often leftist and might want to distance with trump and elon.
Fundamentally,
Year | 2025 | 2026 | 2027 | 2028
EPS | 2.90 | 3.85 | 4.96. | 6.40
EPS growth% | 18.02% | 32.82% | 28.87% | 29.12%
Fair forward p/e for a company growing EPS 20%+ with a moat is ~ 30
Fair stock value:
Year | 2025 | 2026 | 2027 | 2028
Stock price ( base case p/e = 30) | $87 | $115 | $148 | $192 |
Stock price (bear case p/e = 20 ) | $58 | $77 | $99 | $128 |
Stock Price ( bull case p/e = 50 ) | $150 | $192 | $248 | $320 |
- Bulltard + Elon musk premium p/e if ELON divorces with Trump = 100
Stock price ( p/e = 100 ) | $290 | $385 | $496 | $640


$TSLA Sales Slump but is Support Near?Is Tesla ( NASDAQ:TSLA ) facing a sales slump and an overpriced valuation? In this video, we dive into the latest Tesla stock analysis, starting with the declining sales numbers and why the current valuation might be raising red flags for investors. We then break down the weekly chart, spotlighting a potential breakdown retest as NASDAQ:TSLA price nears key support levels around the 243 weekly SMA. What was once resistance could now flip to support—find out how! Zooming into the daily chart, we explore the 280 price level where the 200 SMA is and outline a possible 5-wave pattern completing at 243, followed by a correction toward Goldman Sachs’ 320 target and Bank of America’s 380 forecast. But could a deeper drop to 200 be on the horizon? Get the full technical analysis, price targets, and insights to navigate NASDAQ:TSLA ’s next move in this must-watch stock market update!


TSLA Potential Bullish Bat PatternOn the daily chart, TSLA has recently fluctuated and fallen, and the bears have the upper hand. The current downside target can pay attention to the previous demand area of 246.6-255.3. After reaching it, you can pay attention to the potential bullish bat pattern, and the buying position is around 243.2.

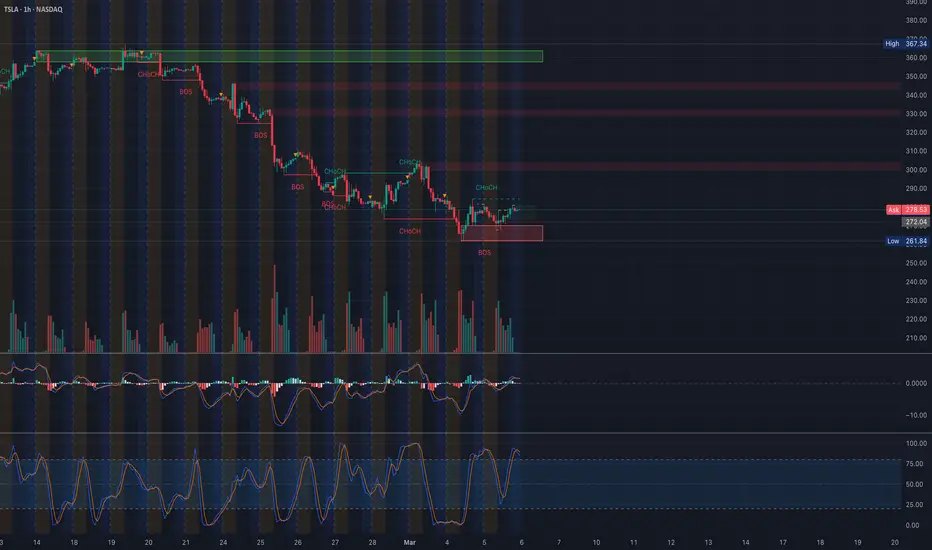
TSLA Technical Analysis – Reversal in Progress?Market Structure & Key Levels
* Current Price: $278.53
* Support: $265, $250
* Resistance: $292.5, $300, $310
TSLA has recently rebounded from a demand zone around $265, showing early signs of a potential reversal. Multiple Change of Character (ChoCH) shifts indicate a possible transition from a bearish to a bullish market structure.
Reversal Zone Analysis
TSLA has entered a potential reversal zone between $278 - $292.5. If price sustains above $278, upside momentum toward $300 and $310 could unfold. A failure to hold $278 could send it back to retest the $265 support level.
Options & GEX Analysis
* IVR: 84.1
* IVx Avg: 80.3
* GEX: Green (bullish positioning)
* Put Walls: $265, $250
* Call Walls: $292.5, $300, $310
Options flow indicates bullish sentiment, with increasing call interest above $292.5 and strong put support at $265.
Trading Plan & Strategy
Bullish Scenario (Preferred)
* Entry: Above $278 with strong volume confirmation
* Target: $292.5, then $300
* Stop-Loss: Below $272
Bearish Scenario (Less Likely)
* Entry: If price rejects the $292.5 - $300 zone
* Target: $265
* Stop-Loss: Above $295
Options Trade Idea
* Bull Call Spread: Buy $280 Calls, Sell $300 Calls (April Expiry)
* Credit Put Spread: Sell $270 Puts, Buy $260 Puts
Final Thoughts
TSLA is showing early signs of a reversal, but needs to hold above $278 for confirmation. Watch for strength toward $292.5 and $300. If price struggles at resistance, a retest of $265 is possible.
Disclaimer:
This analysis is for educational purposes only and not financial advice. Please do your own research and manage risk accordingly.


TESLA Can it really reach $900?Tesla / TSLA hit its 1week MA50, having declined by -45% from its December 2024 All Time High.
This is a critical Support junction as besides the 1week MA50, the price hit both the former Falling Resistance and the Rising Support of the April 2024 low.
Last time we saw the exact same pattern was after the March 2020 COVID crash tested the 1week MA50 and rebounded.
The rebound went all the way to just over the 2.0 Fibonacci extension.
This is why we remain bullish on Tesla, targeting $900 (Fibonacci 1.5 extension).
Previous chart:
Follow us, like the idea and leave a comment below!!

