TESLA SWING LONG IDEA - TSLA We had a great run on Tesla after Trump's election, which boosted the idea of Robotaxi and green earnings over time.
If you follow me on X, you would know that I have been buying Tesla since the $204 level (August 5th crash). We had a great run from there to $490.
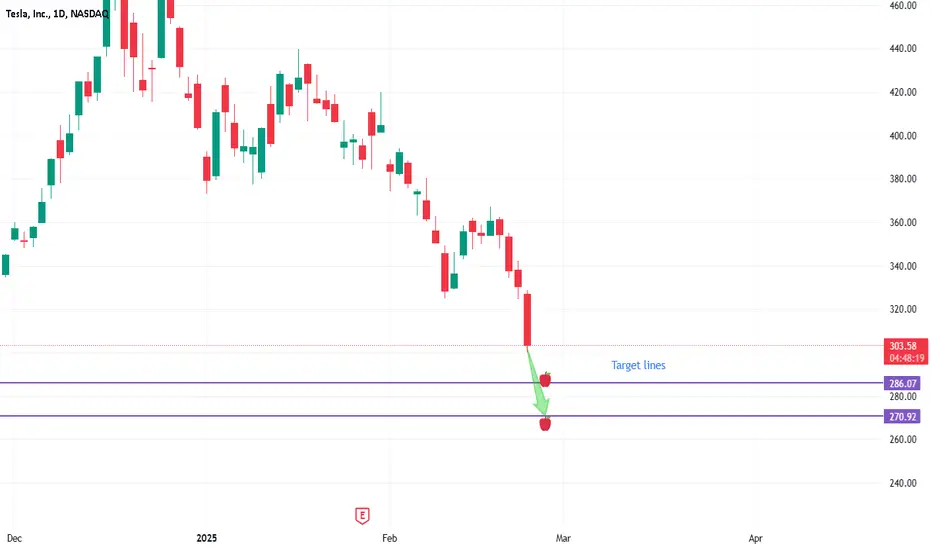
Currently, we have seen a 33% retracement from the top.
The price hit the weekly demand zone and showed a strong rejection there (forming a weekly dragonfly doji).
I have started to build a swing position from this level to ride Tesla to new all-time highs.
The first challenge will be the bearish trendline that has been driving the bearish trend since December 18th. Breaking that trendline should lead to new highs, in my opinion.
If the price breaks and closes below $300 on the daily chart, it will invalidate my setup, and I will look to exit the position.
0R0X trade ideas

Quick 4-Min Tesla Analysis: Deeper Pullback or Ready for LiftoffJust wrapped up a quick Tesla analysis (under 4 min)! Right now, we could see a dip to the $289 zone before pushing higher, or a deeper move down to $250 before driving up toward $475.
Where do you think Tesla is headed next? Let me know your thoughts!
Kris/Mindbloome Exchange
Trade Smarter Live Better

TSLA: Buying opportunityOn TSLA as you can see on the chart we would have a high probability of having a buying opportunity depending on the configuration of the chart.

#Tesla $TSLA is approaching key levels. NASDAQ:TSLA D1
Key levels:
$300: 1 Year demand zone.
$280: 200 SMA + a significant lower channel wedge extending since April 2024.
A bounce from these levels will fuel more momentum to $375 or more.
A weekly close below $270 will unlock a new zone extended down to $230
#TSLA #TESLA #STOCKS #AHMEDMESBAH

TSLA Buy on 270 and 200We have two scenarios: The first is between 250 and 270, and the second is 200. The main support levels are indicated.
I plan to buy 60% of my remaining balance at 270. If the price falls below 270, I will purchase an additional 40% of my remaining balance.

Tesla monthly supportPrice just landed on the monthly support and psychological level of $300. I don't think is going to break down. I just bough TSLL. SL triggers if a weekly candle closes below the support level.

Weekly & Monthly Closing on a Positive Note is Important.Immediate Support is around 355 - 357,
if this level is Sustained on Monthly basis,
we may witness further upside around 400.
However, the monthly candle is not yet closed.
Weekly candle closing above 357 - 360 may confirm
a Morning Star Formation which will be a Positive Sign.
Strong Resistance is around 400 - 415.
Crossing & Sustaining 490, may lead it towards 600.

YOLLO TESLA TO $400'S ISH.... After weeks and weeks and weeks trying to find a button it looks like a Tesla found the bottom today. Take a look it looks promising. It looks like we could rebound to the low 400s at least and that is a good distance from here. Tesla remains a great company with increasing revenue from everywhere. You cannot sort it forever eventually reverse. I think Tesla has reached an extreme again.

TSLA Shorts, done in 15minKnowing when your model shows up and when to pull the trigger is important. This TSLA short was the exact model I have been posting for the last few weeks, if you see previous posts. Partials taken, trade is risk free. May swing couple.

$Tesla at a Crossroads: $330 Recovery or $259 Drop?Following MARKETSCOM:TESLA 's recent drop to $300, this analysis examines the critical support level that has recently formed and highlights $312.50 that could determine whether the stock recovers toward $330 or continues its downward trend to $259.

Tesla (TSLA) Share Price Drops by Over 8%Tesla (TSLA) Share Price Drops by Over 8%
The Tesla stock chart today paints a grim picture for investors, as TSLA's price during trading on 25 February:
→ fell by more than 8% in a single day;
→ dropped below the psychologically significant $300 per share mark for the first time since early November 2024 (despite nearing $500 in late December 2024).
Why Tesla (TSLA) Shares Have Fallen
Tesla’s sales in Europe fell by 45% in January compared to the same period last year, even as overall EV sales in Europe grew by 37%.
This sharp drop in European sales has heightened concerns that CEO Elon Musk’s political activities are negatively affecting the company’s business.
Technical Analysis of Tesla (TSLA) Stock Chart
Price movements in 2024 formed a key upward trend channel (marked by blue lines), but yesterday’s decline led to a bearish break below the lower boundary of this trend. Specifically:
→ The $330 level, where the lower blue boundary was breached, now appears to be a significant resistance level.
→ The B→C retracement is approximately 50% of the A→B decline – a bearish signal.
→ Price movements in 2025 outline a descending trend channel (marked in red), which is becoming increasingly relevant.
If the psychological support level of $300 per TSLA share fails to hold, the price may continue to decline towards the key $270 level. This level acted as resistance to growth in the second half of 2024 but was broken after news of Trump’s victory.
Tesla (TSLA) Share Price Forecast
Analysts remain cautiously optimistic, possibly hoping that Musk’s close ties with Trump will help accelerate the launch of Tesla’s robotaxi service.
Another potential positive driver could be Tesla’s entry into the Indian market.
According to TipRanks:
→ 13 out of 35 surveyed analysts recommend buying TSLA shares;
→ The average 12-month price target for TSLA is $357.
Trade on TradingView with FXOpen. Consider opening an account and access over 700 markets with tight spreads from 0.0 pips and low commissions from $1.50 per lot.
This article represents the opinion of the Companies operating under the FXOpen brand only. It is not to be construed as an offer, solicitation, or recommendation with respect to products and services provided by the Companies operating under the FXOpen brand, nor is it to be considered financial advice.

TESLA: Tesla sales fall by 50% in Europe! Fear ??
Tesla vehicle sales in the European Union fell by 50.3% in January 2025, compared to the same month last year, according to figures published on Tuesday by the European Automobile Manufacturers Association (ACEA). Specifically, the company sold 7,517 units in the first month of this year, compared to 15,130 vehicles in January 2024, according to EFE.
This drop contrasts, however, with a 34% increase in the purchase of electric vehicles in the EU, up to 124,341 units, so that this type of vehicle represented 15% of the automobile market.
In global terms, new vehicle registrations fell by an average of 2.6% in the community market, with the largest declines recorded in France (-6.2%), Italy (-5.8%) and Germany (-2.8%). Spain, however, was the only one of the four major EU economies in which new vehicle registrations increased, specifically by 5.3%.
--> What is the company's technical aspect?
If we look at the daily graph, the medium-long term trend is still bullish (Bull), but it is in a phase of decline that began on December 17 when it reached highs in the 488 area.
Yesterday, the shares plummeted by -8% due to the news of vehicle sales in Europe, reaching the KEY ZONE of 299 (61.8% Fibonacci + most important dynamic support). From this area, it is MOST LIKELY that there will be an upward rebound, but until this rebound is consolidated and the STRENGTH AND MOMENTUM turn bullish (Bull), the retracement phase will remain active.
--> Which area could be good for entering long positions?
If the price exceeds 383 with the H4 close, we could confirm the end of the retracement and the beginning of a new bullish impulse on the way to highs.
-------------------------------------
Strategy to follow:
ENTRY: We will open 2 long positions if the H4 candle closes above 383
POSITION 1 (TP1): We close the first position in the 429 area (+12%)
--> Stop Loss at 349 (-9%).
POSITION 2 (TP2): We open a Trailing Stop type position.
--> Initial dynamic Stop Loss at (-9%) (coinciding with the 899 of position 1).
--> We change the dynamic Stop Loss to (-1%) when the price reaches TP1 ( 429 ).
-------------------------------------------
SET UP EXPLANATIONS
*** How do we know which 2 long positions to open? Let's take an example: If we want to invest 2,000 euros in the stock, what we do is divide that amount by 2, and instead of opening 1 position of 2,000, we will open 2 positions of 1,000 each.
*** What is a Trailing Stop? A Trailing Stop allows a trade to continue gaining value when the market price moves in a favorable direction, but automatically closes the trade if the market price suddenly moves in an unfavorable direction by a certain distance. That certain distance is the dynamic Stop Loss.
-->Example: IF the dynamic Stop Loss is at -1%, it means that if the price drops by -1%, the position will be closed. If the price rises, the Stop Loss also rises to maintain that -1% on increases, therefore, the risk is increasingly lower until the position becomes profitable. In this way, very solid and stable price trends can be taken advantage of, maximizing profits.

WHERE IS TESLA GOING???Tesla latest earnings report sent shockwaves to investors with earnings per share and revenue missing Wall Street expectations. The stock initially dropped in after hours trading but managed to rebound a little as the market digested the report . With mixed sentimental surrounding the automotive giants near term prospects, lets take a look at the stock technical positioning.
Tesla reported Q4 2024 earnings per share of $0.73, missing the concuss estimate of $0.76.
Revenue came in at $25.71 billion falling short of the expected $27.26 billion. From technical perspective Tesla is trading around $375 if this neckline break it shall test the support around 340- $257.Thats the area where buyers previously stepped in during November 2024.

TSLA - Prepare to buy $282 - $264 Tesla has been in a 3 month pull back and the price is almost right to pull the trigger on a re entry. She is however ahead of schedule by a solid 2 full months in time. This usually resolves itself in price. Meaning a break down to lower support levels. So if the regression to the mean price level is at $282, we could see slippage down to $264 quite easily and it is almost expected. $250, is easily reachable as well. If we break down below $250, I would take a knee on this one, and wait passed the June 11 date to re-enter. Murrey Math, Elliot Wave, and Kumar wave being used for the forecast. Posts and Dm's always welcome. Good Luck!

TSLA at a Critical Level! Reversal or More Pain Ahead? Feb. 26Technical Analysis (TA) & Price Action
Tesla (TSLA) has been in a sharp downtrend, breaking key support levels and forming a descending channel on the 1-hour chart. The stock is now testing a crucial demand zone around $300, which aligns with a major PUT wall and strong buyer interest.
Key observations:
* Trend Structure: TSLA is currently in a falling wedge pattern, often a sign of potential reversal.
* Support & Resistance:
* Major Resistance: $320 (previous breakdown level).
* Key Support: $300 (PUT Wall and highest negative NETGEX).
* Breakout Target: $340 if TSLA regains momentum.
* MACD Indicator: Bearish but showing early signs of a possible crossover.
* Stoch RSI: Oversold, suggesting a potential short-term bounce.
Options Flow & GEX Analysis
The GEX (Gamma Exposure) indicator reveals heavy PUT positioning near $300, making it a high-stakes level. A break below could trigger a gamma-driven sell-off, while holding above could fuel a short-covering rally.
* IVR (Implied Volatility Rank): 62, with IVx avg at 71.7%, indicating high volatility.
* Call Side Bias: 31.3% of options flow, meaning some traders are betting on a bounce.
* Key GEX Levels:
* PUT Wall & Key Support: $300 → Breaking below could see more downside toward $290-$280.
* CALL Resistance & Upside Target: $340 → Breaking above this level would confirm a reversal.
Trade Plan & Suggestions
📌 Bullish Reversal Play (If $300 Holds)
* Entry: Above $306 with strong volume.
* Target 1: $320
* Target 2: $340 (CALL Wall breakout target).
* Stop-loss: Below $297
📌 Bearish Breakdown Play (If $300 Fails)
* Entry: Below $297 with volume confirmation.
* Target 1: $290
* Target 2: $280 (Potential next support).
* Stop-loss: Above $310
Final Thoughts
TSLA is at a make-or-break level, with $300 acting as the battleground. If buyers step in, we could see a relief rally toward $320-$340. However, if selling pressure continues, a break below $300 could lead to a further slide toward $280. High volatility means traders should be cautious and wait for confirmation before entering a position.
📢 Risk Management: Adjust stop-loss levels and position size accordingly. This setup has high risk but also high reward potential.
🔹 Disclaimer: This analysis is for educational purposes only and does not constitute financial advice. Always conduct your own research and manage risk accordingly before trading.

$TSLA - chart update. All line on this NASDAQ:TSLA chart are bull gaps. The first gap is at $255. That's a good spot for a technical bounce. Gaps will fill more than 90% of the time..

Tsla bounce incoming?NASDAQ:TSLA
After a hard pullback on tsla since reaching new highs on dec24, it has now retraced to the .5 fib from dec22 lows.
Both macd and rsi are on oversold conditions and we just bounced on the last support/resistance flip zone.

$TSLA testing new lows, Downside not complet yetAfter hitting an ATH NASDAQ:TSLA has lost the momentum. In this blog space we already propagated the idea that there is some more downside until the reaches the 200 Day SMA. We see that NASDAQ:TSLA stock has lost the 20 Day, 50 Day and 100 Day SMA and the next stops are the 200-Day @ 276 $.
But if we look at the Fib Retracement then the levels @ 0.618 with price 273 $ and the Fib level @ 0.786 with a price 215 $ are the key support level. If it reverts back to the 0.786 Fib level then it will loose all its election related gains.
But in contrast S&P 500 and NASADAQ100 are consolidating and not breaking down as $TSLY. So, we might see NASDAQ:TSLA underperforming the NASDAQ:QQQ over the next few weeks.
Long AMEX:TSLY between 250 $ and 200 $.


TESLA ANALYSISI have used the depth analysis on price and time . And just used the trend & candle-stick pattern. It is in downtrend.

Why Tesla Stock Could FallHi traders this is why tesla could fall in the coming days.
- Musk’s political alignment with Trump may alienate environmentally conscious buyers and complicate international expansion, especially in markets like the EU where Chinese competitors face high tariffs.
- Tesla's 2024 annual deliveries fell for the first time in its history (1.79 million EVs, down 1.1% from 2023), missing Wall Street expectations and raising doubts about its ability to achieve Musk’s 20–30% growth target for 2025.
- Tesla has repeatedly slashed prices in China to maintain market share, but this strategy is eroding profit margins
- Tesla’s P/E ratio of 200 far exceeds peers like Apple or Microsoft
- Tesla’s growth narrative hinges on Full Self-Driving (FSD) and robotaxis, but regulatory approval delays and technical challenges persist, these initiatives are unlikely to generate significant revenue before 2026
I am looking for shorts around 409.74, Targeting 291.89 with stop loss at 468.74

Tesla (TSLA) Scalping & Mid-Term AnalysisMarket Overview
Trend: Strong Bearish 📉
Resistance: $309.30 → EMA 200 acts as a ceiling
Support: $296.00 → Local demand zone
Indicators:
MACD: Bearish, no reversal confirmation
RSI: Oversold (17.96 on 30m) – potential for short-term bounce
VWAP: Below average – sellers control momentum
🩸 Risk: High probability of a short squeeze if volume spikes
🔥 Scalping Strategy (5x Leverage)
🩸 Momentum Scalping:
Buy: Near $297–$299, targeting $305
Sell: Near $305–$309, targeting $298
Stop-loss: Below $295
🩸 Breakout Scalping:
Above $310: Long to $318
Below $296: Short to $290
🔥 Mid-Term Trend Forecast (1-3 Weeks)
If $310 holds, potential retest of $320
If $296 breaks, freefall to $285
🔥 News & Market Context
🩸 Tesla planning major initiatives in early 2025, including Model Y Juniper launch & self-driving advancements → Bullish Long-Term
🩸 However, short-term market reaction is bearish due to macro pressures
🔥 Decision:
🩸 Short-term: Scalp long near $297, sell at $305+
🩸 Mid-term: Avoid heavy long positions until $310 breaks
🩸 Ideal Play: Short bounces, enter longs only above $310
👑 Final Verdict:
"Survival isn’t about guessing—it’s about acting before the rest wake up." – LucanInvestor

Tesla AnalysisNext target for Tesla. I have analyzed it using Gann , wave, trend. Mantain 6-7$ stop loss.