Stalking TSLA! TESLA is still on SeekingPips RADAR🌍SeekingPips is still a long time holder of TESLA.🌎
⚠️ The secret here is to identify key levels on the HIGHER TIMEFRAME CHARTS.✅️
ℹ️ ALWAYS REMEMBER this, without a TRIGGER there is NO TRADE ✅️
0R0X trade ideas

TSLA around a confluence zone : Technical Analysis and ForecastTSLA Technical Analysis and Forecast
Tesla (TSLA) is currently positioned at a critical confluence zone, where both horizontal and ascending trendlines intersect. Should the selling pressure persist and the stock breaks below the $325 level, there is a potential for further downside movement toward a psychological support zone at $300.
It is important to note that TSLA has experienced a significant decline of approximately 33% from its peak on December 18, 2024, which could indicate potential for a rebound at these levels.
Given the stock's current discount, I believe it may present a compelling opportunity for long-term investors. I intend to continue building my position through a disciplined Dollar-Cost Averaging (DCA) strategy, gradually accumulating shares as the price moves lower.
Should TSLA reach the $300 mark, I consider it a strong buying opportunity.
As always, please trade with caution and consider your risk tolerance before making any decisions.

TSLA on the Radar! Big Move Incoming? Key Levels to Watch! 📈 Market Structure & Price Action
TSLA has been in a downtrend channel, showing strong selling pressure, but has recently bounced off the lower trendline, signaling a potential reversal. The trendline resistance above remains key to watch. Bulls need to see a breakout above $342.5 for further upside confirmation.
* Support Levels: $330, $320, $300
* Resistance Levels: $342.5, $370, $380
Indicators & Momentum Analysis
* MACD: Slight bullish crossover emerging, signaling momentum shift.
* Stoch RSI: Overbought but still pointing up, suggesting room for upside movement.
Gamma Exposure (GEX) & Options Setup
* Call Walls: Heavy resistance at $380 and $400, indicating strong gamma hedging from market makers.
* Put Walls: Heavy support at $330 and $320, suggesting downside protection.
* IVR: 40.8 (moderate volatility environment).
* Options Flow: Calls dominate at 48.2%, indicating bullish sentiment among options traders.
Potential Trade Scenarios
✅ Bullish Scenario: Breaks above $342.5, confirming a breakout → Next targets: $370, $380
❌ Bearish Scenario: Fails at resistance, falls below $330, testing $320 as next support.
📌 Final Thoughts: TSLA is at a critical level. If it can break above resistance, it could see a strong rally. However, rejection at resistance means more downside potential. Watch for volume confirmation!
🚨 Disclaimer: This is for educational purposes only. Always do your own research before trading! 🚨

TSLA - PREPARE TO BUY $282 Tesla is getting near a low around $296 - $264 or so. With later sell targets at $432 . Using Elliotwave, Murrey Math and Kumar wave.

Under 3-Minute Deep Dive Into Tesla (TSLA) – Big Move ComingTesla just pulled back to $320 on the weekly chart, and this is where things get interesting. If buyers step in, we could see a strong push to $370, and if that breaks, $397 and even $417 are in play.
But here’s the flip side—if Tesla loses $320, things could unravel fast, and $250 might not be far off.
I’m watching this level closely because the next move could be huge.
Kris/Mindbloome Exchange
Trade Smarter Live Better

easy mid-term long play on teslaeasy idea, don't tink too much, elon musk trump blabla, easy technical chart, nice triangle, nice long, nice profit, cheers!

TSLA - UPDATE LONGWe inverse this displacement and close, we can see us back above ATH. Buyside liquidity targets in chart.

TESLA Is this the right time to buy again?Right at the start of the year (January 02, see chart below) we issued a Sell Target on Tesla (TSLA) at $330:
This was based on the 1-year Parabolic Growth Channel of the stock, which formed a Higher High and was already in the rejection phase. The 330 Target was hit yesterday, the price touched the bottom of the Channel and we already see a recovery attempt today.
The condition that completes the strong buy sentiment that is emerging on Tesla, is that it hit yesterday the 1D MA100 (green trend-line) for the first time since October 23 2024. As you can see, the last two times that the stock traded on its 1D MA100, it was the most optimal buy opportunity.
Following a -33% decline on the previous two corrections of the Parabolic Channel, we've always seen an immediate rebound of at least +43.38%. As a result, we expect Tesla to initiate the new Bullish Leg, which, before a Higher High, can target on the short-term $465 (+43.38%).
-------------------------------------------------------------------------------
** Please LIKE 👍, FOLLOW ✅, SHARE 🙌 and COMMENT ✍ if you enjoy this idea! Also share your ideas and charts in the comments section below! This is best way to keep it relevant, support us, keep the content here free and allow the idea to reach as many people as possible. **
-------------------------------------------------------------------------------
💸💸💸💸💸💸
👇 👇 👇 👇 👇 👇

Bonus Analysis: 80 Stocks Reviewed, 15 Stand Out!Hello readers!
First things first – if you find value in these analyses, don’t hesitate to hit the Boost/Like button! 🚀 Your support helps keep these ideas coming and is greatly appreciated. Thanks a lot!
As an extra bonus for everyone who participated in the survey, I decided to go through all the mentioned stocks—a total of 80 different names—and pick out the ones that stood out to me from a technical perspective. Made just a brief overview.
Previously, I covered the top 15 most mentioned stocks, but now it's time to highlight 15 additional setups that caught my eye with very short descriptions. These are purely technical insights—no fundamental analysis here.
To be said, many of the stocks mentioned were at all-time lows, which means technical analysis isn’t much help. If a stock is sitting at the bottom with no structure, you’re relying purely on fundamentals to make a decision.
With that said, let’s take a look at the charts that stood out.
1. Oklo (OKLO) – Nuclear Energy
Strong momentum, but for me, the most important area is $20 to $30.
2. Tecnoglass (TGLS) – Glass and Window Manufacturing
Steady higher highs - The strongest zone sits between $50 to $60.
3. MicroStrategy (MSTR) – Software and Bitcoin Holdings
Extremely volatile but key interest zones for me are $170 to $240, with $200 as a strong mid-point.
4. Everest Group (EG) – Reinsurance and Risk Management
$250 to $280 was a strong resistance, now acting as support. Trendline retest and third-touch scenario align well with the $230 to $280 range.
5. H. Lundbeck (HLUN_B) – Pharmaceuticals
Resistance turned support has already played out but still, there might be some volatility, and $35 to $40 DKK remains the strongest zone.
6. Alpha Group International (ALPH) – Financial Services
Breakout and retest already worked well, so waiting for slightly better prices might be the best move but it is valid.
-------
I’ve picked out the first six stocks from the survey and shared my technical insights here on TradingView but this is just the beginning.
9 stocks in Substack with some bigger names like Alibaba (BABA), Starbucks (SBUX), Snowflake (SNOW), Uber (UNER), and Netflix (NFLX) have also caught my eye, and I’ll be covering them on my Substack along with more technical breakdowns.
Substack-ENG link is in my BIO (clicking the website icon), or you can find it by scrolling up - just below the main image.
See you there,
Vaido

Advanced Trading Strategy Using Fibonacci Levels & Price ActionIntroduction
In this article, we analyze a trading setup using Fibonacci retracement levels, trendlines, and key support/resistance zones. This approach helps traders identify potential entry and exit points while managing risk effectively.
1. Market Context & Trend Analysis
The price action shows a strong uptrend, with a sharp rally followed by a pullback.
Fibonacci retracement levels act as key areas where traders anticipate price reactions.
The dotted trendline in the chart indicates a possible continuation of the bullish trend.
2. Fibonacci Retracement Levels as Key Support Zones
Fibonacci retracement levels help traders determine where price might reverse or consolidate:
38.2% Level (355): A shallow retracement, often indicating strong bullish momentum.
50.0% Level (344.14): A neutral pivot zone where buyers might step in.
61.8% Level (272.96): A critical "golden ratio" support level where price frequently reverses.
3. Trading Strategy & Entry Points
A. Bullish Trade Setup (Buying Opportunity)
Entry Conditions:
Enter near the 50% Fibonacci level (~344) or if price consolidates above the 38.2% level (~355).
Confirmation signals:
Bullish candlestick formations (hammer, engulfing, or pin bar).
Increased volume at Fibonacci levels.
A bounce from the trendline, showing trend continuation.
Profit Targets:
Target 1: Retest of previous swing high.
Target 2: New highs if momentum sustains.
Stop Loss:
Below 61.8% Fibonacci level (~273).
Alternatively, use an ATR-based dynamic stop loss.
B. Bearish Trade Setup (If Price Breaks Down)
If the price fails to hold above the 50% Fibonacci level, further downside is possible.
Entry Conditions:
Enter below the 50% Fibonacci level if weakness is confirmed.
Confirmation signals:
Break of trendline support.
Increased selling volume.
Failure to reclaim key Fibonacci levels.
Profit Targets:
First Target: 61.8% Fibonacci level (~273).
Second Target: 100% retracement (~139.66).
Stop Loss:
Above 38.2% Fibonacci level (~355) or the previous high.
4. Risk Management Guidelines
Risk-Reward Ratio: Ensure a 1:2 risk-reward ratio for each trade.
Position Sizing: Limit trade exposure to 2-5% of total capital.
Trailing Stop Loss: Adjust stops dynamically to lock in profits.
Volatility Consideration: Avoid trading during high-impact economic news events.
5. Conclusion
This Fibonacci-based strategy offers high-probability trade setups while maintaining controlled risk. However, traders must wait for confirmation signals before entering. Monitoring volume, price action, and trend continuation is essential for maximizing profitability.
This strategy can be adapted to multiple timeframes and assets. Traders should backtest and refine the approach based on market conditions.

TSLA : Deja VueMotif seems to be repeating... Expecting a Target of 220-230 during Spring/early Summer.

TSLA in Free Fall: How Low Will It Go ?Tesla is in free fall – and so far, there’s no sign of a turnaround. The 38.2% retracement zone has been hit, but let’s be honest: there’s no real bounce yet. Here’s why I expect the stock to drop further towards $360 – and how I’m positioning my entries.
Since mid-December, NASDAQ:TSLA has been in a clear downtrend on lower time frames, with no serious buying momentum yet. My first entry is already set as a limit order just below current support. If sellers keep the pressure on, a second entry below the untouched VWAP could make sense – with a tight stop in case TSLA takes another dive.
I’m staying on top of this and ready to adjust, but one thing’s for sure: The moment TSLA shows it’s done bleeding, it's going to send higher!

Tesla 2025: Bull vs. Bear – Opportunities and Risks Bullish Thesis :
Tesla is looking incredibly bullish for 2025! 🚀 Strong EV demand keeps growing, and Tesla remains the market leader.
FSD & AI breakthroughs could unlock massive revenue through robotaxis. The energy business is expanding fast with solar and battery storage.
A new affordable Tesla model is set to drive major market share growth.
Cybertruck production is ramping up with strong demand. Manufacturing efficiency is improving at Giga Texas, Berlin, and Shanghai. Optimus, Tesla’s humanoid robot, could tap into a trillion-dollar market.
Government incentives and energy credits continue to support Tesla’s growth. Advancements in 4680 battery tech improve efficiency and cut costs. Global expansion into markets like India is fueling further growth.
The Supercharger network is opening to other automakers, creating new revenue streams. The Dojo supercomputer and Tesla AI innovations could redefine multiple industries.
Stock buybacks may boost investor confidence, and Tesla’s strong balance sheet ensures continued innovation. With all this momentum, 2025 could be a huge year for Tesla!
Bearish Thesis:
EV competition is heating up, with legacy automakers and Chinese brands like BYD gaining market share.
FSD and robotaxi ambitions face regulatory hurdles that could delay adoption. Margins are under pressure due to price cuts and rising production costs.
The global economy and high interest rates could slow down EV demand. Tesla’s reliance on Elon Musk’s leadership is a risk, especially with his focus on multiple ventures.
Cybertruck production challenges and potential delays could hurt expectations. Scaling 4680 battery cell production remains a hurdle. China, one of Tesla’s biggest markets, poses geopolitical risks and increasing competition.
The energy business, while growing, still lags behind vehicle sales in profitability. Stock dilution from employee compensation plans or capital raises could impact share value.
If Tesla fails to meet its aggressive AI, FSD, and Optimus robot timelines, investor sentiment could turn negative. With these risks in play, Tesla's 2025 outlook isn’t without challenges. ⚠️

TESLA is in an oversold zoneVery soon we should start the next leg up, currently oversold so would be reasonable to expect a bounce soon

$TSLA yieaahhhliterally a year ago on Feb 2024 I posted a beautiful chart that we nailed precisely.
Coincidence we meet again one year later? I hope yieahhhh
Strong confluences
1. 50% fib retracement
2. mid line on the parallel channel dating to stone age
3. RSI on weekly at 50
4. RSI on daily closed right at 30
Gamma exposure is heavy into the negative side - reason of the big selloffs vs other names that buy the dips - making this risky but I will stop right there, I only know how to draw lines.
IMO if this support doesn't hold, we might see 246 uff.
Yieaahhh

Tesla UpdateDamn it feels good to be right, lol. No in all seriousness, we knew this move lower was coming. I've been preaching about it for what, 2-3 weeks now. This pattern has appeared corrective for some time now, we just finally got the follow through over the last couple days. If this pattern is to proceed in a standard fashion, then we should get the microwave 4 & 5 next, followed by the sub-minuette wave iv & v. I imagine this will take a week or two to play out but as you well know by now, there is nothing that governs time. For now, I am watching the $300 area (+/- $10) for a possible bottom. This thing could easily extend lower though to the 1.382 or 1.618 @ $280.15 & $252.91 respectively.
Once we get towards the bottom of this pattern, I plan on taking a swing long to trade the (B) wave higher. I am expecting a roughly $100 swing at that point. I just sit here wondering what WILL cause that kind of a swing, not if. Don't get me wrong, that will be a b wave and they're historically complex. They don't always hit standard targets, but even if it only hits the area of the 0.382, that is still a $60-$70 swing. Now, these numbers I am mentioning right now are VERY rough estimates as we still don't even have a bottom formed. They're based on standard targets and are subject to change.
Once we get some more price action to play out, I will have more refined targets. For now, I am just waiting for the bottom to form so I can finally take another position in Tesla. As you know though, I am picky and very patient. If it doesn't pan out as expected, then so be it. I will have no qualms about missing out on a trade.

TSLA at a Critical Level! Reversal or Further Downside?Market Structure & Price Action:
* TSLA has been in a strong downtrend, breaking multiple support levels.
* It has rejected the descending trendline, continuing lower.
* Current price is hovering near $327, testing a key PUT support level.
🔍 Key Levels:
* Support:
* $327 – Strong PUT support (highest negative NETGEX).
* $295 – 2nd major CALL wall support.
* $250 – Long-term support if downside continues.
* Resistance:
* $360 – Heavy resistance from PUT wall.
* $380 – 3rd CALL wall resistance.
* $400 – Strong CALL resistance (37.69%).
📊 Indicator Analysis:
1️⃣ MACD:
* MACD is deep in negative territory, showing strong bearish momentum.
* A possible crossover could indicate a short-term relief bounce.
2️⃣ Stochastic RSI:
* Oversold conditions, indicating potential for a relief bounce.
* Needs confirmation with price action.
3️⃣ 9/21 EMA:
* TSLA is trading below both EMAs, confirming strong bearish structure.
* Needs to reclaim 9 EMA for any bullish reversal attempt.
🔥 GEX & Options Sentiment:
* PUT Support at $327: This is a critical level; a break below can accelerate selling.
* Call walls at $360 & $380: Resistance levels where buyers may struggle.
* IVR 51 / IVx 66.6: Moderate implied volatility, suggesting steady options activity.
🛠️ Trading Plan:
📉 Bearish Scenario (Break Below $327):
* If TSLA fails to hold $327, expect a drop towards $295.
* Ideal PUT entry: Break below $327 with volume.
* Stop Loss: Above $335.
* Profit Target: $300-$295.
📈 Bullish Reversal (Above $327):
* If TSLA reclaims 9 EMA & holds $327, expect a bounce towards $350-$360.
* Ideal CALL entry: Reclaim of $335 with strong volume.
* Stop Loss: Below $320.
* Profit Target: $350-$360.
🎯 Final Thoughts:
* TSLA is at a key decision point.
* A break below $327 triggers more downside.
* A bounce above $327 could offer a short-term relief rally.
🔔 Trade carefully & manage risk!
⚠️ This is not financial advice. Always do your own research before trading.

TSLA From Erection Come Correction UpdateSince my initial post, TSLA has lost usmuch as 24% of its total value.
Do not expect new highs anytime anytime soon. At best it will flip-flop at these levels for a while. Again this is the best case scenario.
Fundamentally TSLA is way overvalued. it is not even something anyone can debate rationally.
Despite the horrible fundies, I did offer a buy signal early on for a nice 40% gain plus based on technicals and Euphoria. Chaart below.

Tesla a buy opportunity?Tesla: An Opportunity?
Despite mixed results in several of its quarterly reports, there are several catalysts that could indicate that the recent price pullback might be a buying opportunity.
Revenue Growth: Tesla is expected to continue its revenue growth, driven by the expansion of its product portfolio and the adoption of its North American Charging Standard (NACS) by other automakers.
Innovations and Launches: Tesla plans to launch several new models in 2025, including a more affordable vehicle with a base price of around $25,000.
Challenges and Competition: Although Tesla remains a leader in the electric vehicle market, it faces increasing competition, especially from Chinese manufacturers.
Financial Outlook: Despite some uneven financial results in recent quarters, analysts remain optimistic about Tesla's long-term prospects. Revenue is expected to grow steadily, and gross margins are expected to stabilize as the company reduces costs.
Impact of AI: Tesla is investing in artificial intelligence technologies, which could further drive its growth and solidify its market position.
Bonus: Tesla is expected to launch its robotaxi service in Texas in June 2025 and the Optimus humanoids in 2026.

Tesla Battery Running Flat? Recharge Incoming at $300 Continuing from the previous Tesla breakdown, we can see price has respected the green zone, aligning with the previously called full-swing projection. As price approaches its high, it’s likely to face some retracement before the next significant move.
Key Levels to Watch:
- Point of Interest (POI): The Fair Value Gap (FVG) at the $300 zone presents a high-probability area for price to recharge and gather momentum.
- Next Upside Target: After the retracement, expect a push higher to retest the green zone and potentially make new highs.
Tesla’s price action remains dynamic, with opportunities for both retracements and breakouts. Always ensure proper risk management when navigating these setups.
Conclusion:
Short-term: Retracement to the $300 FVG zone.
Medium-term: Continuation upward targeting the green zone for new highs.
DYOR!

TSLA AccumulatingI'm a buyer here, nice sell side and Order Block that caused BoS, it has gas to move higher, if we head lower, ill look for entries at $242 Order Block/sweep.

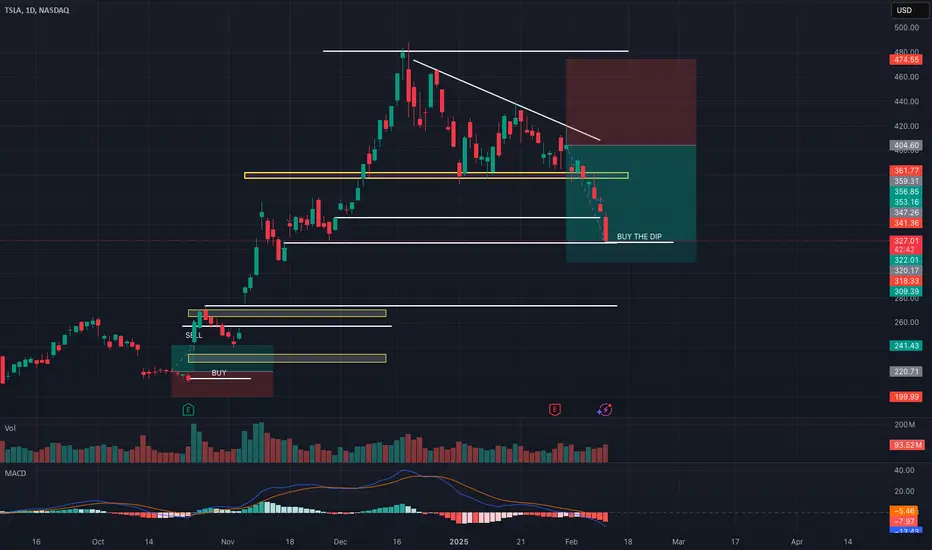
TSLA, BUY THE DIP, right now, right here...We are filling the gap, right now.
If we go fill the second gap at 275, keep some money to DCA... ;)