Next report date
—
Report period
—
EPS estimate
—
Revenue estimate
—
1.40 USD
738.38 M USD
1.64 B USD
About OIL & GAS DEVELOPMENT CO LTD
Sector
Industry
CEO
Ahmed Hayat Lak
Website
Headquarters
Islamabad
Founded
1961
FIGI
BBG000R4B1X0
Oil & Gas Development Co. Ltd. engages in the exploration and development of oil and gas resources. It also involved in exploration, drilling, process and plants, production, reservoir management, and engineering support. The company was founded on March 4, 1961 and is headquartered in Islamabad, Pakistan.
Related stocks
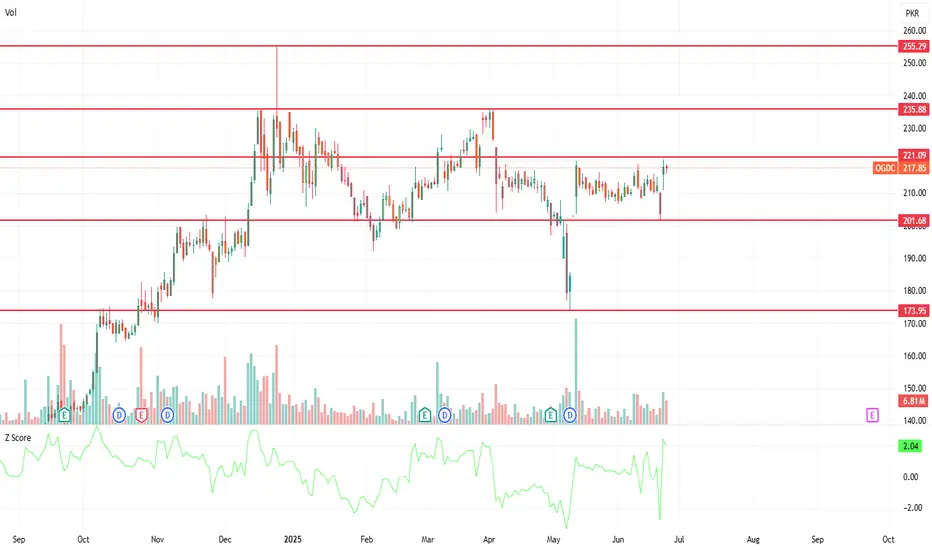
OGDC PROBABLY IN WAVE ' B ' OR ' 5 ' - LONGOGDC is most probably in wave B or 5
Currently the price is forming a flag pattern as minor wave b or 2 which might continue to build this week. As per our preferred wave count we are only looking to buy OGDC once it breaks above the flag formation.
Last minor swing high is at 213.50 at the moment

OGDC SHORT TRADEODGC is continuing on its bearish trajectory, it tested its recent breakdown level today around 208
SHORT OGDC 202-206
TP 194
SL 209

Bullish on All Time Frames.Bullish on All Time Frames.
Monthly Closing above 211 - 212 would
be very positive for OGDC.
Retested the Previous Breakout Level
around 194 - 195.
Hidden Bullish Divergence on Daily Tf.
227 - 228 is the Weekly Resistance that
seems to break this time.
If this level is Sustained, we may witness
250

OGDC - LongFrom a technical point of view, the first target should be Rs 237, and the long-term target is Rs 335.
On fundamental grounds, the current fair value of this share should be around Rs 228, but if the circular debt issue is resolved and the company starts giving dividends around Rs 40 - Rs 45 than t

OGDCOGDC Analysis
Currently at channel top if breaks 224 and sustained then will go further up
No any Negative sign in Daily/Weekly


OGDC-LONGstrong fundamental stock standing on its support and Lower trendline it can bullish from here and
moves upward upto its target o upper trend line a golden chance of 90-100 % return

OGDC - PSX - Buy Trade CallOGDC has been sideways after making a HH and even broke its regression channel. It has now made a bullish hidden divergence on RSI.
Although KVO is still down but it is anticipated to gain momentum due to good news coming up from OGDC management.
Trade Values:
Buy-1: 214 (Current Market Price)
Buy

OGDC is SUPER BULLISH long term.OGDC is SUPER BULLISH long term.
OGDC is bullish on long term investment and can be multiple X value from current price.
However, price never move in a straight line, therefore currently we will focus on nearest mid term (3-5 years) targets, after which OGDC shall strongly consolidate.
At present

See all ideas
Summarizing what the indicators are suggesting.
Neutral
SellBuy
Strong sellStrong buy
Strong sellSellNeutralBuyStrong buy
Neutral
SellBuy
Strong sellStrong buy
Strong sellSellNeutralBuyStrong buy
Neutral
SellBuy
Strong sellStrong buy
Strong sellSellNeutralBuyStrong buy
An aggregate view of professional's ratings.
Neutral
SellBuy
Strong sellStrong buy
Strong sellSellNeutralBuyStrong buy
Neutral
SellBuy
Strong sellStrong buy
Strong sellSellNeutralBuyStrong buy
Neutral
SellBuy
Strong sellStrong buy
Strong sellSellNeutralBuyStrong buy
Displays a symbol's price movements over previous years to identify recurring trends.