OGDCWe can attempt to buy OGDC from specified level if it give breakout of range/yellow consolidation box , also there is no bearish divergence at current levels indicate that it move upward .
SL , TP mention in chart.
OGDC trade ideas

OGDC/PXSThe "bearish bat" pattern is yet another harmonic pattern used by traders in technical analysis to forecast potential reversals in financial markets. Similar to other harmonic patterns, it's based on Fibonacci ratios and consists of specific price swings.
Here's an overview of its characteristics:
1. **XAB Leg**: The pattern starts with an initial price move from point X to point A. This leg represents the initial impulse move, often in the direction of the prevailing trend.
2. **ABC Leg**: After the XA leg, there's a corrective move from point A to point B. This leg usually retraces a significant portion of the XA leg, often to Fibonacci retracement levels like 38.2%, 50%, or 61.8%.
3. **BCD Leg**: Following the ABC leg, there's another price move from point B to point D. This leg usually extends beyond the XA leg, often to a Fibonacci extension ratio like 0.886 or 1.618.
4. **CD Leg**: The final leg of the pattern, from point C to point D. This leg typically retraces a portion of the BCD leg, often to Fibonacci retracement levels like 38.2%, 50%, or 61.8%.
When traders identify a bearish bat pattern forming, they interpret it as a potential reversal signal, suggesting that the price may decline after completing the pattern. However, as with any trading strategy, it's essential to confirm the pattern with other technical indicators or price action signals before making trading decisions. Additionally, risk management techniques should always be employed to manage potential losses.

OGDC (Intraday/Short Swing)OGDC weekly Breakout confirmed going for a big target of 160, the short Target for Traders is 137-140.
Great volumes and closing above weekly resistance.
Buy OGDC at 133-129.
Sell at 137-140.
SL At 127.

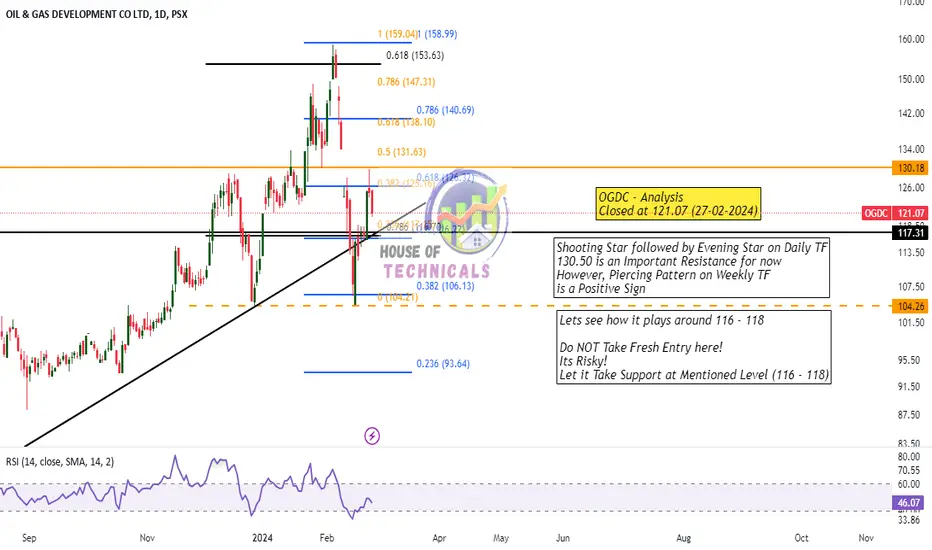
Shooting Star followed by Evening StarShooting Star followed by Evening Star on Daily TF
130.50 is an Important Resistance for now
However, Piercing Pattern on Weekly TF
is a Positive Sign
OGDCAfter the double bottom formation is observed in OGDC share around 104.50. The price action is currently testing resistance level of around 130 which breach and sustains can pull the price towards next resistance of 145. Stop loss can be placed below 115. Moreover, MACD indicator is lightening bearish histogram soon we can expect crossover.

OGDCFollowing the identification of a double bottom formation in OGDC shares around the price point of 104.50, recent price action indicates a rejection from its resistance level situated at 130, culminating in a closing figure of 121.07 during the latest trading session. Notably, support is discerned within the range of 114-118, where a pullback is anticipated subsequent to the validation provided by a confirmation candle. Presently, the stock manifests a "wait and watch" scenario, conducive to the contemplation of initiating a long position.

OGDCOGDC Buy from specified level (also 0.618 FIB , trendline support intact)
SL , TP mention in chart

OGDCPlan1
Buy Above 121
Sell around 125 then 128 - 129
Stoploss 115 (Closing basis)
Plan2
Buy around 114 - 116
Sell around 118 - 119
Stoploss 112 (Closing basis)


Still BullishQuick Trade:
Buy1 around 138.30 - 139.30
Buy2 around 135.50 - 136.30
TP1 around 142.50 - 143
TP2 around 147 - 148
Stoploss 126 (Closing basis)
For Patient Traders:
Buy1 around 131 - 132 | Sell around 140 - 145
Buy2 around 119.50 - 121.60 | Sell around 130
Stoploss 119 (closing basis)

PSX OGDC OutlookOGDC is picking momentum with consistently part of volume leader and heading to break the last Higher High. entry is commended upon the breakout and sustaining above of last HH 129
Entry:129
StopLoss:113
TP1:145
TP2:161


OGDCIt is Good as Long as it stays above 106.
Buy on Dips.
However, if 106 is broken, we may see trend reversal.

OGDC is BullishOGDC is currently in a strong bullish momentum and printing new higher highs followed by higher lows, the trend is expected to continue further. Targets are mentioned on the chart.

OGDCQuick Trade:
Buy Above 111
Sell around 114
Stoploss 105 (closing basis)
Then wait for 115 Breakout and enter for
the Target of 124

PSX: OGDC READY TO RISE, EVEN HIGHER.OGDC had its recent high at the start of August which is around Rs111. Afterwards it went into consolidation. on 18th October it had a low of around 93 reminding me the Wyckoff.
The volumes have been picking up since the start of October and on Friday it staged a breakout which, in my opinion, shall continue, as the RSI is also displaying a bullish momentum.
So if the upside targets have been identified along with the Stop Loss.

Oil & Gas Development Company OGDC: On the hourly time frame, a key support level is identified at 99.50. Consider entering a long position if the price remains above this level, but be cautious if it drops below, as it may signal further downward movement.

ODGC:PSX is continuing bearish trendOGDC is in bearish parallel channel and has made a beaarish flag pattern at the top of the downward channel. Short Entry has been placed on break of Flag Pole with suitable SL and TP1 and TP2.

OGDC:PSX is making potential Bearish Harmonic Reversal patternOGDC:PSX is in process of making potential Bearish Harmonic Reversal pattern. PRZ (Point D) has been initially foretasted at fib 0.886 but may extend further upto 1.618. A short entry is planned below point B through a sellstop order with SL above point C. At PRZ (point D), upon confirmation of bullish reversal through divergence on RSI, a long entry through buystop shall be initiated once HHs and HLs of the trend are confirmed.


OGDC: Head & Shoulders appearingPSX:OGDC graph has formed head & shoulders which suggest potential downward trend. It can form lower lows towards the mark point around PKR 60.
