RELIANCE--Head and Shoulders pattern(Right-Shoulder) Forms??Observations:
-------->>the stock is trending upwards.
-------->> We have observed a left shoulder formed at 2300 level. Now if price falls back to 2300 level and if the same is acts a support we will
observe a Head and Shoulders pattern in Reliance.
--------->> Previously a strong fall is observed from the zone 2425-2455.If the same zone is acts as resistance we will observe a fall in reliance up to
2300 Zone.
------>> we have a demand zone @2360-2380 level which can act as a pullback to the same zone(2425-2455). and price may fall back to 2300 levels
very quickly from this zone.
Keep an eye on these levels.
RIGD trade ideas

Tryout SMS RelianceReliance 4h SMC homework
in 4 hour still on the downtrend as it has not broken internal highs so 4h reversal BOS not formed yet

Reliance Industries: Go long above 2494 with long term viewThis is a long term analysis on Reliance Industries on 4 hours TF
Buy only above breakout pivot range <2447 -2497>
For swing position target will be 2689, buy above 2497
For long term holding , buy on major breakout above 2689 , targets projected using Fibonacci levels are 3003/3320/3515
Long term investors should exit if Stoploss pivot range breaks <2246-2124>


RELIANCE INDUSTRIES: GO LONG ABOVE 2494This is a long term analysis on Reliance Industries on 2 hours TF
Buy only above breakout pivot range
For swing position target will be 2689
For long term holding , buy on major breakout above 2689 , targets projected using Fibonacci levels are 3003/3320/3515
Long term investors should exit if Stoploss pivot range breaks

Reliance: NeutralReliance not yet participated in the rally in Indian market.
Reliance = 10% of Nifty,
Hence, it's very important to understand the direction Reliance takes to understand Nifty50 direction.
My view is neutral, and entirely depends on which side the Relative Momentum breaks out/down. We will know very soon!

Swing Trading Stocks - Reliance IndustriesThis Stock is one of heavy weights of Nifty. If Nifty has to perform, then this stock has to outperform its previous resistance. 2468 looks like a temporary rejection level, above that it would fly to take index at higher levels along with its pal "ITC"!

RELIANCE PATTERNInverted head and shoulder pattern spotted in Reliance daily time frame.Do your study and comment your findings

RELIANCE gave a breakout through head and shoulder patternNSE:RELIANCE gave a breakout from the head and shoulder pattern, best place to bet market having a positive sentiment thus chance of bullish move has more probability, can turn into a good return of up to 5% on invested capital.
target - 2560
sl - 2330

long reliancereliance trade line breakout also price above cloud.. it may give rally till 2460 +++..analysis fail below 2370... good risk to reward...

RELIANCE Looks BullishMA cross overs and Strong RSI along with head & shoulder pattern suggest a bullish trend in Reliance


Reiance Cup & Handle PatternLooks like reliance is getting ready for breakout. If sustained above the horizontal line then can give move up and if sustained above 2500 then it can blast

Reliance can be short term good Bouce Reliance as falling massive from ATH
now time to be some retracement till 2375 2420
STOP LOSS 2180 60
BUY RELIANCE 2300CE 09 12 SL 06 TGT 22 44 55 64+++

reliance going to go upthis is based on my own analysis:
entry- BETWEEN-2360-2362
minimum tgt- 2388
sl- CLOSE BLW- 2350

Reliance- failed to create a strong High falls below 2350 ??Observations:
A strong sell off is observed after opening gap up , so will expect a downward momentum in reliance to the level 2290.
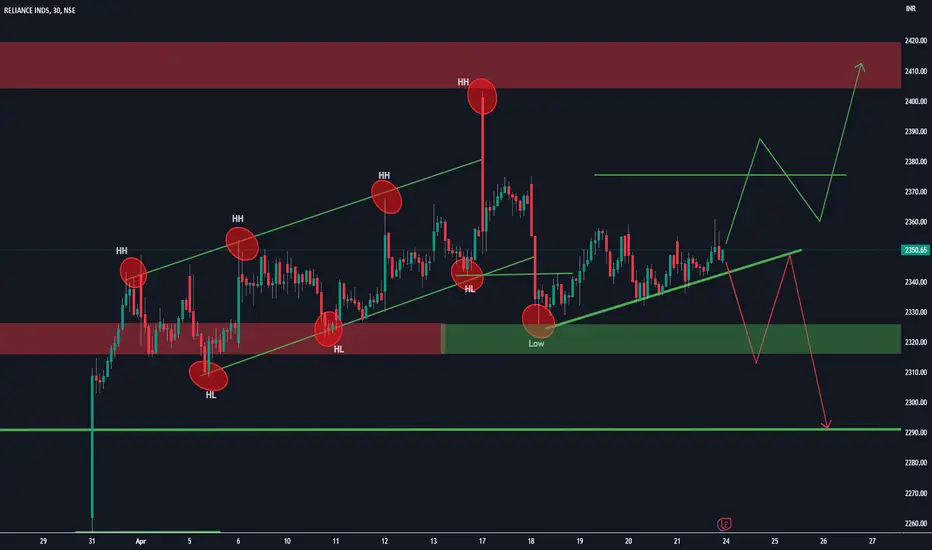
The RELIANCE has been trending upwards, but recently it broke through the higher low level at 2342 and dropped to a low of 2326.
However, the previous supply zone at 2326 has acted as a demand level, causing the price to rise weakly towards the upside.
At this point, it is uncertain whether the stock will continue to move higher or form a lower low.
Further analysis is required to determine the likely direction of the price movement.
Note:
As of now it is in bullish, slightly turned to be bearish as a low is formed and weak momentum is observed towards high.

INTRADAY IDEA ON 24-04-2023in reliance will take a long and short trade,this content is made for learning and educational purposes only.

RELIANCE-Will create a lowerlow or continue upside.The RELIANCE has been trending upwards, but recently it broke through the higher low level at 2342 and dropped to a low of 2326.
However, the previous supply zone at 2326 has acted as a demand level, causing the price to rise weakly towards the upside.
At this point, it is uncertain whether the stock will continue to move higher or form a lower low.
Further analysis is required to determine the likely direction of the price movement.
Note:
As of now it is in bullish, slightly turned to be bearish as a low is formed and weak momentum is observed towards high ,it may create lower low or can rise towards a strong level of resistance at 2400.
INTRADAY IDEA ON 20-04-2023in reliance we will take a long and short trade this content is made for learning and educational purposes only


RELIANCE LOOKS LIKE IT IS ON IT'S WAY DOWNWill look at Shorting Reliacen below 2330 Levels.
RELIANCE LOOKS LIKE IT IS ON IT'S WAY DOWN

RELIANCE FALLING WEDGE BREAKOUT AND CONSOLIDATION DAILYREADY TO MOVE 10-15% once 2400 is taken out reliance will blast but we are having result on 21 april only that factor one should consider before going long ... charts seems very bullish.

Reliance ( upside possible )A good trendline breakout, with consolidation for a week.
A good buy above 2337.15, support level with a SL of 50-53 points for targets of 2447, 2606 & 2732.
Trade wisely at your own risk appetite,
Good luck, Jai Hind.
