Lisk LSK // Bitcoin BTC price analisysInteresting event is coming up, so Lisk price may budge.
Check info about upcoming events on BlockchainMuffin.com
LSKBTC trade ideas


There is a possibility for the beginning of an uptrend in LSKBTCTechnical analysis:
. LISK/BITCOIN is in a range bound and the beginning of uptrend is expected.
. The price is below the 21-Day WEMA which acts as a dynamic resistance.
. The RSI is at 49.
. The RSI downtrend & The price downtrend in the daily chart are broken, so the probability of the resumption of an uptrend is increased.
Trading suggestion:
. There is a possibility of temporary retracement to suggested support zone (0.00054740 to 0.00041200). if so, traders can set orders based on Price Action and expect to reach short-term targets.
Beginning of entry zone (0.00054740)
Ending of entry zone (0.00041200)
Entry signal:
Signal to enter the market occurs when the price comes to "Buy zone" then forms one of the reversal patterns, whether "Bullish Engulfing" , "Hammer" or "Valley" in other words,
NO entry signal when the price comes to the zone BUT after any of the reversal patterns is formed in the zone.
To learn more about "Entry signal" and the special version of our "Price Action" strategy FOLLOW our lessons:
Take Profits:
TP1= @ 0.00076560
TP2= @ 0.00088700
TP3= @ 0.00103390
TP4= @ 0.00111760
TP5= @ 0.00135230
TP6= @ 0.00155210
TP7= @ 0.00173000
TP8= @ 0.00190550
TP9= @ 0.00225620
TP10= @ 0.00339820
TP11= Free

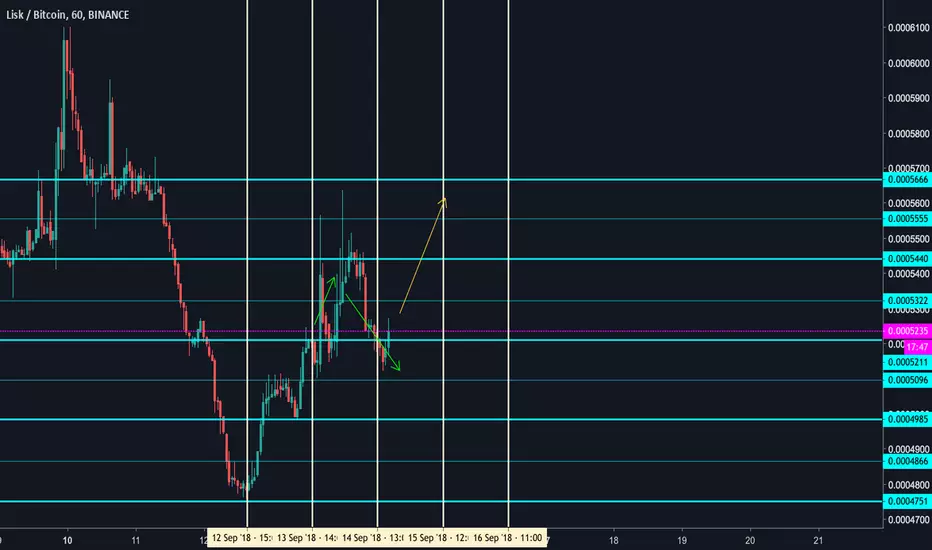
LSKBTC Trading Idea and Potential Buy opportunityLSK has been trading in a Symmetrical triangle and this pattern hit the bottom and price bounced off it, we expect the price to attempt to test the top side of the triangle pattern.
Possible Entry is clearly stated on the chart.
BLUE: POSSIBLE ENTRY ZONE
GREEN: SELL TARGETS
Join our discussion room for more about our trading signals.
Please do click on like icon and share our idea.
Thanks.

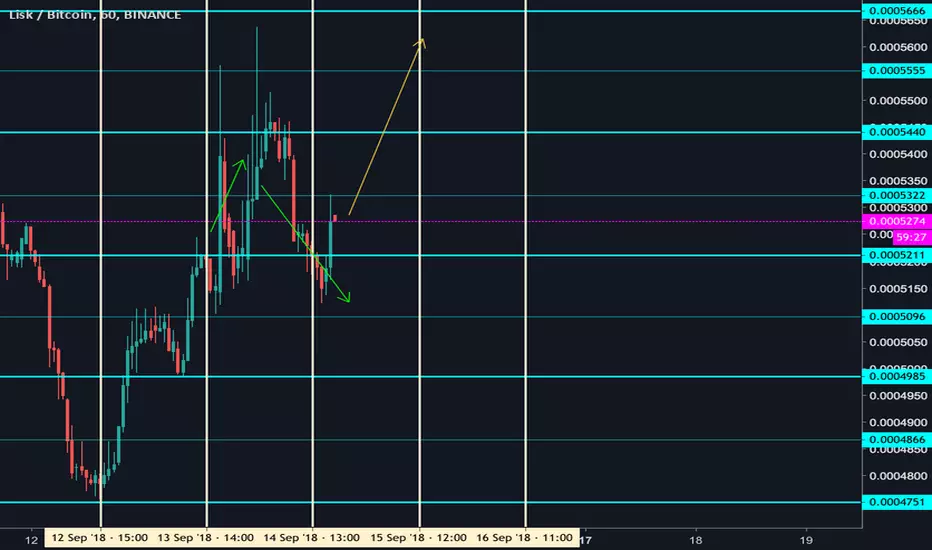
LSKLSK :
buy : 0.0005211
Sell :
Level 1 : 0.0005440
Level 2 : 0.0005555
Level 3 : 0.0005666
Stop :
two candles under :
0.0005096
LSKLSK :
buy : 0.0005211
Sell :
Level 1 : 0.0005440
Level 2 : 0.0005555
Level 3 : 0.0005666
Stop :
two candles under :
0.0005096
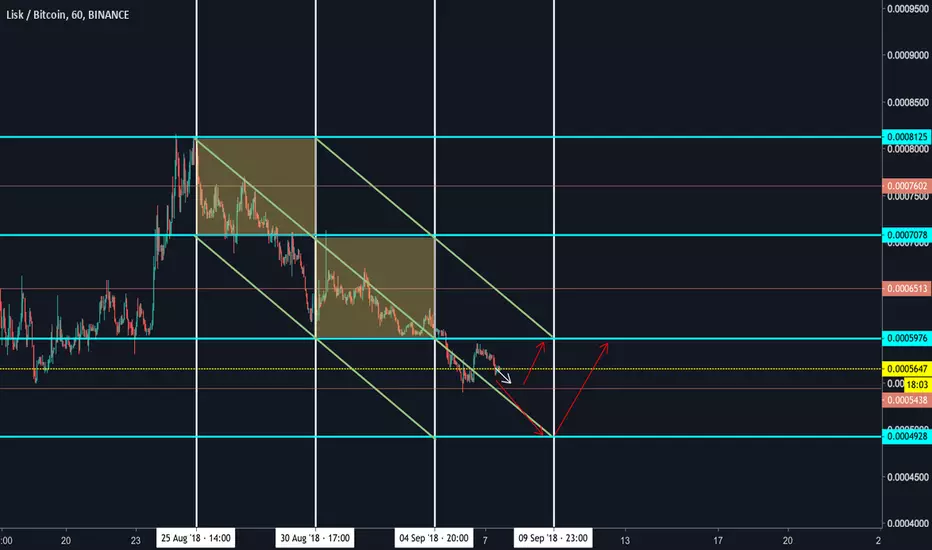
LISKBTCi think it's time for lisk to move, it's better from 0.00050840 (green line 23.6% fibo)
tp1: 0.00066060
tp2: 0.00081000
tp3: 0.00105700
tp4: open
------------------
sl: 0.00041200

LSK Lisk - Strong buySame price support 2017, 98% pump, top 23 coin, this is a strong buy! This retrace is a great opportunity

Analytics LSK/BTCA very popular previously and now undervalued coin. Its rate approached in August to its minimum, which is 0.0003917. A little before reaching this price, the coin shot up and showed about 50% growth. Volumes grew, while the asset stay in portfolios.
To date, we are seeing a price of 0.000610, which is 50% of Fibonacci. This is an area of interest both for sellers and buyers, so we do not consider the entry point more than 0.0004850-0.0004780. The next good entry is 0.000412-0.000415.
There is an upward trend, the distribution of orders in DOM is equable.


Lisk long tradeLisk looking good, looks like a breakup of the trendline . 1h MACD cross, bullish divergence , bounced off support and golden pocket fib zone, lots of room above.
Fundamentals are great for this coin.
Long with SL at 0.0005333

#LSK WITH NICE SETUP (#Bittrex #binance #coinbase)#LSK chart shows strong support. Blue lines are resistance - book profit!
Happy Trading!
Crypto Guide Team

LSK offering promising swing trade opportunityLSK recently bounced off all time low price around 40 before doubling up and hitting 80ish. pulled back to secondary support of 60 over last week or so. Seems ready to try a leg up now.....
Assuming the broader market continues its uptrend, i think this offers a pretty good R:R as it has a lot of upside potential
currently at 6120ish
entry: <6250
s/l: <5875 (-6% from 6250)
T1: 6950 (+11% from 6250)
T2: 8000 (+28%)
T3: 10000 (+60%)
if we zoom out and look at bigger view, i debated a bit on where to place those fib lines, but its current location seems to fit well, which is where i get my 3rd target from.

Technical Analytic for #LSK #Lisk (04/09)#LSK (LSK/BTC)
Buy : 6250
Flash Sell : 6300-6400-6500-6600
Short Sell : 6700-6800-6900
Long Sell : 7000-7250-7500-7750-8000
Stop : 5900
Follow me for more signals
Inbox me for more and more signals

LISK GOES UPLISK is at the trend line, the chart shows the areas of contact of the support line. During the last touch, the trend line broke through, but the asset quickly returned to the growth zone.
Now the LISK is testing the support line, and then, with a high probability, it has grown at least to the 0.236 and 0.382 of the last asset growth.
Zone of resistance indicated.
Take profit - blue horizontal line

Can LSK make the dream come true?Come on LSK what are you afraid of? :)
I will be watching this one, I entered around 12600

101% Profit Potential [9:1 RR (3:1 Actual)]Personal Tracking
Trade details:
Buy-in: 6189
Hard SL: 4092
but if price closes below 5490, exit on retrace to this level
First target (25% Holdings) - 7752
Second target (50% Holdings) - 8286
Third target (Holdings) -
Final target (25% Holdings) - 12480

LISK LONG IDEALISK IS ON BUYING ZONE NOW.
MY TARGET IS:
1. 0.0008646
2. 0.0009104
3. 0.0009646
4. 0.0011278

