LSK REFLECTION BOTTOM ! Traders,
This channel is strong we'll see reflecting next few days at this ledge and I'm expecting that we will continue to move upwards new all time high.
Regards,
Mohsen
LSKBTC trade ideas

LSKBTC SHORTLISK coin looks good on short term. Now, we will start 5 wave's elliot.
Price bounced off trend line so We can take a position on 250-270k.
First target: 320-350k.
Stop-loss:180-220k

Lisk (LSK) Technical Analysis and Potential Trade. Live Updates!I've been long BINANCE:LSKBTC for a while now, I think it's time I publish an analysis for those of you looking to get in to BINANCE:LSKBTC for the first time or for those of you that have been holding and are looking for targets. I personally like this coin because I am very bullish long-term on many platform plays including BINANCE:LSKBTC . With the rise in the number of IOT devices and the need for automating and reducing the fees on microtransactions, I think platforms that can scale with wide adoption will be one of the (if not the) highest cap coins down the road. Additionally, the market cap of BINANCE:LSKBTC is right around $1.5 billion, whereas BINANCE:ETHBTC is over $90 billion! To me, I see plenty of room for growth.
The pattern that I have been most telling recently for BINANCE:LSKBTC has been the RSI, the volume, and the MACD. I see that BINANCE:LSKBTC is oversold and believe that it is ready for a rally! If we see similar action as in the last couple of overbought instances, we'll be headed towards the blow target. So, let's trade!
Buy-in: 0.0023-0.0027
Stop-loss: 0.0017 (40% loss)
Targets:
(1) 0.0030663
(2) 0.0032747
(3) 0.0034432
(4) 0.0036116
(5) 0.0038514
(6) 0.0041569
(7) 0.0050390
(8) 0.0064664
(9) 0.0078938
(10) 0.0087759 (325% growth from upper buy-in)
I'd like to hear your thoughts on BINANCE:LSKBTC ! Please comment below, as the more input we see, the more informed we are!
*** This is not a recommendation to buy or sell, this is for educational purposes only! ***

$LSK 10.43% Profit in the new few hoursFalling bull wedge appearing
Increasing volume
MACD deep cross
Nice hammer formed for a reversal
Up up & away!
Twitter: @c6thomas

Lisk Trying To Push Above Key ResistanceSince price had a bullish breakout, price has broker through two key resistance. Now price is trading just under the third key resistance. Look for a bullish breakout from this level or a pullback to key support or lower.

LSK/BTC TREND ANALYSIS AND PRICE FORECAST | FEB 17 |Hi guys,
I'm sharing my trading idea for lsk/btc which has been triggered on a D1 time frame and with rebrading news around the corner, the price can surge in the coming days. We'll be using a tight stop loss as most of the coins with such news start dumping before the news.
TRADE SETUP
BUYING RANGE : 318K SATS OR BELOW
STOP LOSS : 300K SATS
TARGET : 350K, 370K
______________________________________________________________________________________________
DISCLAIMER : THIS IS NOT A FINANCIAL ADVICE BUT THE BEST POSSIBLE PRICE FORECAST ACCORDING TO US. PLEASE DO YOUR OWN RESEARCH BEFORE TAKING ACTIONS.
__________________________________________________________________________________________________________________________________________
FOLLOW US HERE :
YouTube : www.youtube.com (FOR HINDI/URDU)
Telegram : t.me
Twitter : Check out Coin Authority (@CoinAuthorityOG): twitter.com
STEEMIT : steemit.com
Good luck! :)


LSKBTCDon't miss this LSK pump for the rebrand. Check out the github dev activity, it has been a sleeper for a while.
It can retrace after so recommend sell the news

LISK/BTCBINANCE:LSKBTC
LSK showing bullish signs. All MAs lining under the price. Those are good news. We are just waiting on the MACD to give us a entry point. It could also just move horizontally and consolidate a little more.
Confirmation is alway a must in any trading.

Long position in LSK with upcoming hardfork within 2 days.The price action movement is harmonic in well defined channels with consistent uptrend.
RSI has a diagonal support.
MACD buy signal forming .
HARDFORK after 2 days.

Lisk (LSK) - Upcoming Rebrand [Feb2018]INTERPRETATION
BINANCE:LSKBTC will have their anticipated rebrand on February 20, 2018. Delayed since November 2017, early investors will be awaiting good news to finally push the project to exponential gains.
BUY SIGNALS
-possible end of Corrective wave will be the perfect time to kick off the rebrand
CAUTIONS & CONFIRMATIONS
-end of corrective wave
-T&K analysis (TBD)
POSITION
entry @ ~27000-28000 (end of corrective wave)

Lisk (LSK) Consolidation and Resistance Challenge. Going Up?I'm seeing a consolidating wedge forming with BINANCE:LSKBTC . It's done surprisingly well during the COINBASE:BTCUSD downturn. I'm also seeing a nice reversal on the TRIX and the MACD from the last previous spike. If this trend repeats itself, I think we'll see movement towards the upper end of the triangle. The next couple of days will indicate which direction BINANCE:LSKBTC is headed, but it looks like it is preparing to make another jump. If we see the flat pricing and low volume that we've see the past couple of days, it is likely that we'll see BINANCE:LSKBTC head towards that corner that the wedge will form. I'll keep this updated as BINANCE:LSKBTC makes up its mind.
I'd like to hear your thoughts on BINANCE:LSKBTC ! Where do you think it's headed after this consolidation period? Are we headed for a bull run or will the bears finally take it below the bottom support? Please comment below, as the more input we see, the more informed we are!
*** This is not a recommendation to buy or sell, this is for educational purposes only! ***

$LSK still Ranging in a Bullish Rectangle$LSK still Ranging in a Bullish Rectangle and might see a strong bull run if it breaks the rectangle.

LSK/BTC Volume Analysis Prediction 2/13/2018Hi, friends.
It's a new idea on coin Lisk.
Last time we predicted a start of this upward movement.
And now Lisk is still in buy priority.
If the mini-balance goes up then a new uptrend wave will begin.
Also we can buy from a lower mini-balance level.
Trade recommendation:
Entry point: 3365 (buy stop) or 2975 (buy limit)
Stop: 3119 (for buy stop order) or 2848 (for buy limit order)
Target 1: 3650
Target 2: 4000
Glossary of terms
Point of Control (P O C) – The price level for the time period with the highest traded volume .
Value Area (V A) – The range of price levels in which a specified percentage of all volume was traded during the time period. Typically, this percentage is set to 70% however it is up to the trader’s discretion.
Balance - Accumulation Area.
F L - flat level.
T L - trend level.
Fixing (fix, culmination) - reverse price reaction then the markets stops i'ts movement for a short time. The trend stops when it passes through 2-3 fixing movement.


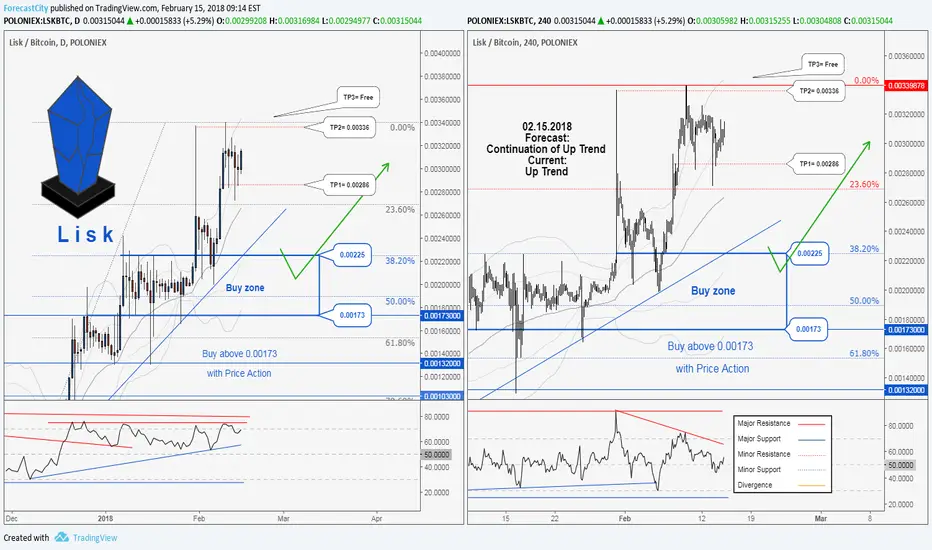
Lisk , A buy trading opportunity in LSKBTC. Be ready !Technical analysis:
.LISK/BITCOIN is in an up trend and resumption of up trend is expected.
.The price is above the 21-Day WEMA which acts as a dynamic support.
.The RSI is at 70.
Trading suggestion:
There is possibility of temporary retracement to suggested support zone (0.00225 to 0.00173), if so, traders can set orders based on Price Action and expect to reach short-term targets.
.Beginning of entry zone (0.00225)
.Ending of entry zone (0.00173)
Entry signal:
Signal to enter the market occurs when the price comes to "Buy zone" then forms one of the reversal patterns, whether "Hammer" or "Trough" , in other words,
NO entry signal when the price comes to the zone BUT after any of reversal patterns is formed in the zone.
To learn more about "Entry signal" and special version of our "Price Action" strategy FOLLOW our lessons:
(We have started to prepare these lessons in TradingView. If you want us to continue, give us feedbacks!)
Take Profits:
TP1= @ 0.00286
TP2= @ 0.00336
TP3= @ Free
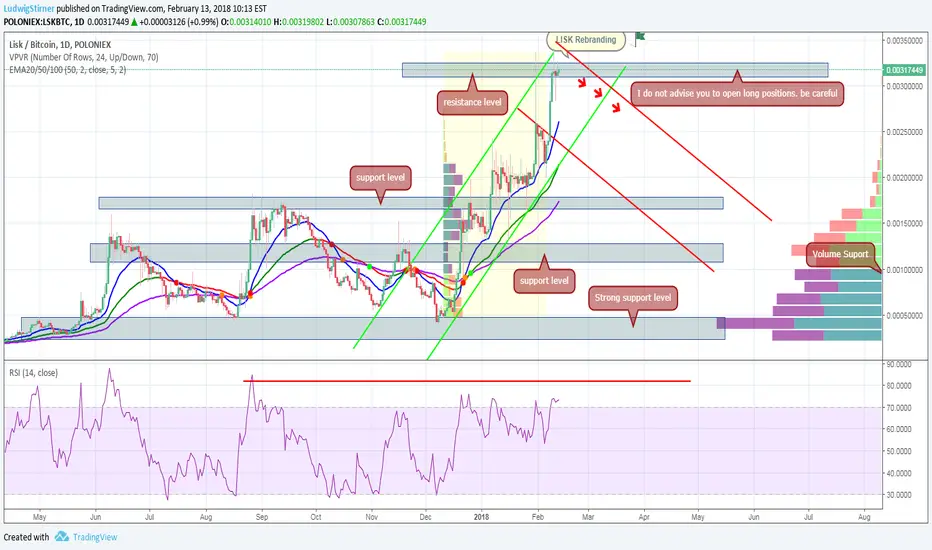
LISKS LAST LIFE!!!?? LSK to rebrand and receive major hype! On a long chart it seems LSK even though its been running up for some time is not done. it has support from multiple MA's moving upwards specifically the MA's we use as apart of the boss method.
BLUE LINE: 7 DAY MA
WHITE LINE: 77 DAY MA
ORANGE LINE: 231 DAY MA
The long term and short term seem to support LSK, we are seeing a bit of a drop but this is expected to pick up real real soon once LSK brands. If the price for LSK falls out of the Red buy zone hands off don't touch it...if you don't trust me watch it, if you do buy in and wait till the 20th when it rebrands and gains strength due to interest.
-TRUSTME

lskbtclsk still in correction zone
major resistance 0.0031256
major support around 0.002929 - 0.0028828

LSK -- A Buy while ConsolidatingHi readers,
I wanted to take a look at LSK before the 20th -- when its set to blow up (The 1.0/Rebranding/RE-Release). This will create a lot of hoop-la. I'm rather certain we will see some liftoff before hand, and I imagine the day of we'll see some crazy volatility -- making having the asset in hand great if you're ready to trade quickly.
Right now we can see the LSK market consolidating. Certainly some of this is the fault of action in BTC. Being as my analysis in The Trend has us Bullish on BTC, the correlation of the two coins has been positive, with LSK usually outpacing it on its moves. That sure sounds like the makings of an explosive move for LSK in the coming week.
I recommend you find a good buy-in and execute on it. Naturally I have highlighted the 23% fib as a good buy. I don't know that you'll get a good chance below that. I recommend taking this chart and "Making it mine" to see if you agree. I'm confident you will, with very little research on this one.


Uptrend coming to an end for LISK?The solid bull run has taken Lisk price into overbought territory. So a long-term correction could be on the chart for LSK coin because a news about rebrending could possibly contributing to price drop.
Right now, Lisk's RSI reading of over 73.1 is used to identify an overbought condition (signal to sell), which is clearly in the overbought territory and an indication that a long-term correction is due for several months.
The bearish sentiment is also reflected by the Bollinger Bands indicator. Lisk price is currently in close proximity to the upper band and a continued rise could see the stock breach the band. These are strong reversal signals, implying that coin price could be headed well lower after rebrending.
If Bitcoin is going to run. Lsk could go this way.Iam still very bullish on LSK. $100 per LSK ahead. The future of lisk is undervalued.
But the volume on LSK is low and the relaunch is more then 1 month away. We all know how long 1 month is in crypto
Big News could change everything.
My strategy:
short 20% of my lisk amount and buy back at lower levels.

Higher trend branched out New highs possible before the 19th if it breaks up the yellow dotted line on the 13th or 14th. Requires larger volumes to come into the market. Volume is not there yet. But in this type of market even 24 hours can make a big difference. That said if it breaks below the the yellow dotted line then it might mean that we need to wait until mid May (could be steady slow increase as well) to see higher price levels. my guess is significant price move will complete within the first week of March rather than finishing up on Feb 19th.
There were two peaks in 2017 June and September. The 3rd arrow in green would have been almost equal to those first two blue arrows in height but it decided to not stop there this time. This is a good sign for much higher prices. Vertical line in the chart is FEB 19th.
