Can the LSK rise to here?LSK has been down for quite some time and is starting to show signs of recovery to regain balance. Can you seize this opportunity or stand by and watch it move to target areas or possibly drop deeper. It is all about market movements. We are investors, the risk is in your control.
LSKBTC trade ideas


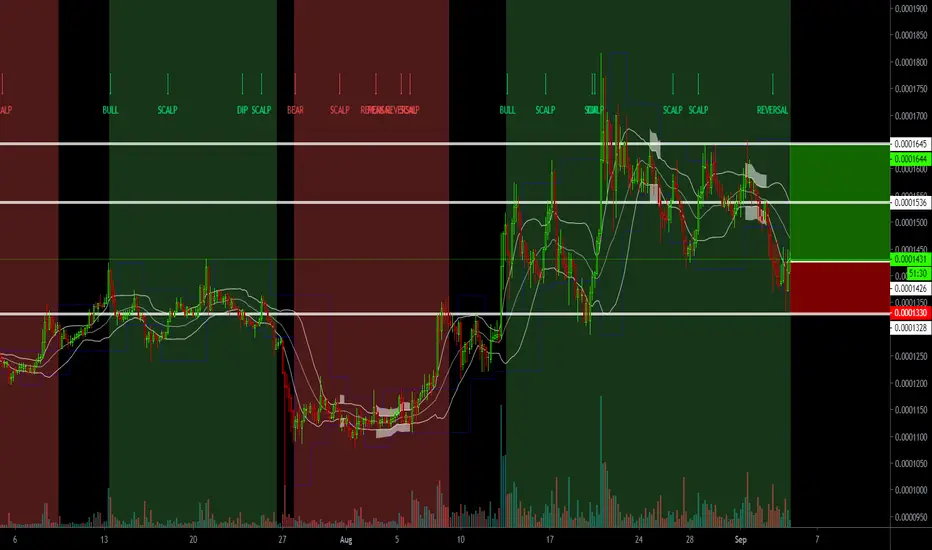
LSKBTC - Long - Potential 15.29%LSKBTC - Long - Potential 15.29%
Entry - 1427
TP1 - 1536
TP2- 1645
SL- 1330
Please comment with thoughts and how you get on.
If you like the idea, then hit like on the idea & support with a follow.
Are the BitBulls back in town?

Lisk-BTC trade idea!!Lisk-BTC trade idea!!
Buy the BREAKOUT!! stop loss under breakout line with space to breathe, (do not buy now, wait for the BRC to place the order)
trade safe!!

LSK/BTC BREAKOUT TRIANGLE PATTERNSo LSK/BTC has now got a breakout of the symmetrical triangle pattern, price is now retesting that trendline as support. What I also see is that the moving averages are all aligned - moving up. Price has also closed above my monthly resistance (pink line) which is bullish. If you use the MACD, you can see that is has crossed - which also indicates bullish momentum.
I have set an alert at daily resistance (blue line) at price 0.00016498 BTC and looking for a potential LONG if we close above that level.


LSKBTC BINANCEmade a higher low after several weeks since 2018 and waiting for a higher high to confirm the up-trend, so that we can expect to reach the targets


LSKBTC - Long - Potential 14.53%LSKBTC - Long - Potential 14.53%
Enter- 0.0001549
TP1- 0.0001702
TP2- 0.0001774
SL- 0.0001480
Happy Trading! Let us know how you get on!

Bullish momentum on LISKHello, traders.
LISK broke an important resistance level and now is accumulating on what looks to be a bullish pattern on intraday timeframes
Like we are seeing, we have a lot of a bullish indication on the chart.
Best regards.


LSK/BTC form BAT or CRAB Harmonic Pattern Lisk form BAT or CRAB Harmonic Pattern
Entry 0.00013
Sell Zone 0.00017- 0.00020- 0.00026 hold Long target 0.00039- 0.00046
Stop-lose: 1D Close below 0.00012


Lskbtc Buy opportunity with 100-250% targetHey guys, spotted potential rising channel with price breakout from falling wedge within the setup.
Focus more on the accumulation zone on the chart for your long opportunity.
Kindly go through the chart and do leave your comments about the expressed view.
Moreover REMEMBER to appreciate my effort with your likes and always subscribe(Click follow) to my profile for fast and quick daily updates on all trading ideas
Thank you.

LSK/BTC - Lisk/BitcoinWe have 2 targets.
1 target - 0.0001427 - 0.0001468 (3.0%)
2 target - 0.0001469 - 0.0001600 (8.9%)

LSK back in business? Downtrend seems to be broken. LSK is a HODL coin of mine, not trading it. But let's hope we can flip 0.0001466 and head over to 0.0002266 and LSK will look attractive again. Sorry not a very informative analysis, but maybe it helps bringing back to your attention.
Oh yeah... I just started to studie MACD, but we see a MACD crossover on the 3D. Seems like a good sign, right?!
Bart

moving 200 & fib div & ichimokuHello friends
Good time
I came up with my own strategy.
For several days now, many currencies have broken their 200 moving average upwards. My choice now is lsk. Have fun

(LISK) High potential Target Mapped...Really important to me Please support my work by like or leave a comment
By "following" you can always get new information quickly.
"THANKS" you in advance for your support
..........................................................................................
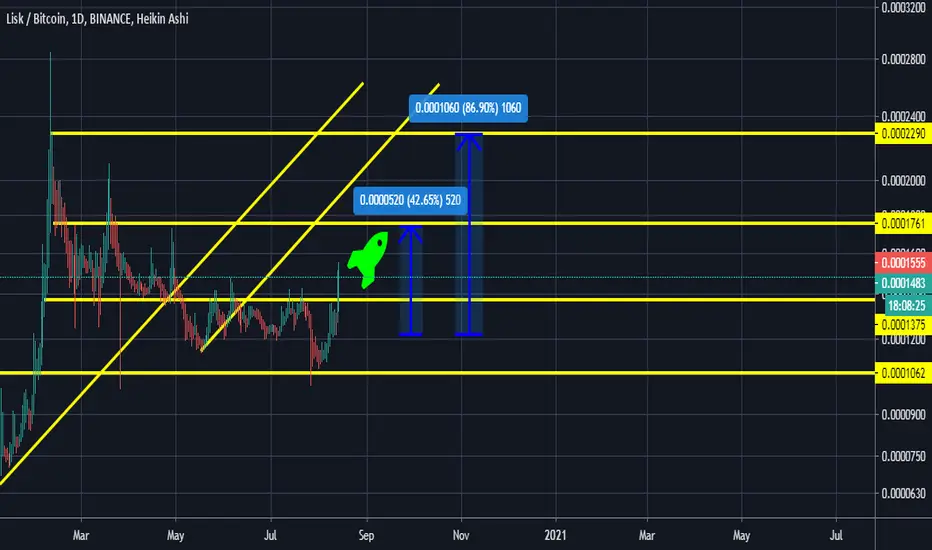
This is middle line signal in Andrew's pitchfork
Andrews believed that market price action would gravitate toward the median line 80% of the time.
Above resistance is a diagonal it, so whatever later price reaches it, the more profit we will get
price above kumo cloud , future cloud is green. before that price could able to crosses up MA200(Yellow line)
and after that has been consolidating and holding the same support level for multiple months(with blue high light mapped)
So potential target will middle line.
GOOD LUCK AND PATIENCE
