$lsk multi-year chart.All indicators point to $lisk launching soon :-)
Keep your fingers crossed. I hope everyone's loaded.
LSKUSD trade ideas
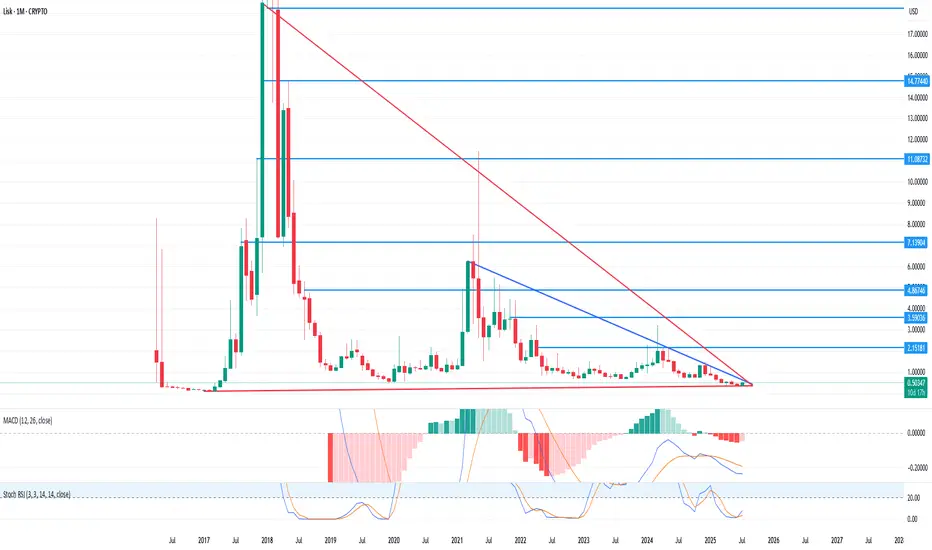
LSK is near BullRunLSK has had an A wave that ended and is now in a B wave.
Wave B looks like a triangle, which we are now in the last wave (wave E).
From the green range, we expect bullish movement towards TPs.
TPs are marked on the chart.
Closing a daily candle below the invalidation level will violate the analysis.
For risk management, please don't forget stop loss and capital management
When we reach the first target, save some profit and then change the stop to entry
Comment if you have any questions
Thank You

LSKUSDTWe can attempt to buy LSKUSDT from specified level as it makes HL , also 0.618 FIB occur indicate that it moves upward.
SL , TP mention in chart.

Lisk Moon Dreams: Scalable sidechains? Eth killer? $164m mcapLisk market cap: ~$164m
Circulating supply: ~144m
What is it?
Founded in 2016, Lisk is a layer 0 smart contract platform enabling DAPP creation in Javascript/Typescript.
Why?
Architecture: Ethereum uses a single blockchain platform which creates scalability issues and potential vulnerabilities like the integer overflow attack. However, Lisk’s SDK and Javascript/Typescript base allows developers to build their own customized sidechains that run on compartmentalized custom logic.
This creates security by design and is theoretically, infinitely more scalable compared to Ethereum’s EVM. This is achieved through the Lisk’s mainchain being interoperable with the sidechains, all of which have their own separate nodes (101 delegates + 2 randomly selected nodes).
Language: Ethereum uses its own programming language called Solidity whereas Lisk employs JavaScript/Typescript for smart contract development. This makes Lisk more accessible to a larger pool of developers who are already familiar with JavaScript/Typescript compared to niche Solidity.
Advantages:
Theoretical scalability and security (separate sidechain logic sidechains compared to Eth EVM) described above.
Dynamic fees.
The Lisk Academy seems to be a clear and comprehensive documentation with a focus on ease of use, compared to other projects.
17 DAPPS in active development (gaming/nft/education/gamefi/infrastructure).
Established team, with PHD researchers, project magazine, an active accelerator and bug bounty program.
Disadvantages:
Lisk’s interoperability solution (planned 7-8 years ago) was only implemented on the main net Dec 2023. Although it has passed alpha and beta implementations and is now in production mode, it is yet to be stress tested by real users en masse.
Currently the development team burns through ~500-700m in funding each month. Applying a liberal spending average of $10m a year, and assuming their base assets (BTC) doesn’t increase, they have ~6 years of funding at which point venture capital sources would probably be sought.
This could be achieved given the novel scaling solution and established team.
Cross-chain swaps between Lisk and other chains (Eth, Avax) have not been implemented yet (but is being planned). Only an interoperability solution, applying within the Lisk ecosystem, was implemented.
No trezor support.
DPOS v POS:
Lisk’s DPOS theoretically creates a higher throughput, better confirmation time, superior energy efficiency and greater protocol flexibility due to less nodes, compared to some POS chains. The downside is centralization concerns, collusion vulnerabilities and less people are able to earn fees/stakes (101 elect delegates, 2+ randomly selected) compared to Eth’s validator requirement (32 eth).
Funding:
As of Nov 2023 the Lisk Foundation has $67m in development assets which includes ~500btc.
Tokenomics:
Lisk’s inflation is ~2% compared to Ethereum’s inflation of 4%.
Lisk’s utility token will be used to transact in different DAPPs like ethereum.
Technical:
Purple lines are halvings. BTC seems to dip slightly before and after each halving. As a result, BTC will likely correct between now and ~2 months after the halving in April. This could cause a decline in USD value of Lisk by 3-30%. A December close under 0.95, could precipitate another month or two of sideways.
One will look for December close above 0.95 followed by at least 2 green weeks of January to evidence stability/bullishness before entry. A good entry could be 0.95-1.10 depending on risk tolerance.
A weekly close below 0.89 would be concerning and invalidate this play until it closed above with strength on multiple weeklies.
Benner cycle:
The meme tier “Agriculture Benner cycle” is also worth considering. This stipulates a crash in 2026. The Benner cycle is often 1 year premature which is why I have drawn a range of 2026-2027 with the two white columns.
Macro:
The 1-2 years proceeding the halving will likely drag all alts up based on previous history. This will likely occur regardless of rates rising or dropping. The global crypto market cap could reach a maximum of x7 to that of Gold’s $13.1t mcap with a ~40% BTC dominance, providing considerable gains to diverse alts like in 2017-2018. This would create a $~250k BTC as the 2026 cycle peak, per the Benner cycle, functioning as a leading indicator to the wider shitcoin market, before entering into a 3y crypto correction, trapping moontards hoping for a mystical $1mm BTC and continued shitcoin growth into 2026.
Crypto is an emerging asset class and in economic recessions, technology performs badly without the infinite M2 hack. Also, Senator Warren’s recently proposed Digital Asset Anti-Money Laundering Act 2022, targeting privacy platforms and strengthening KYC requirements for legally illusory, “unhosted wallet providers,” inducing bears to take a bite out of the crypto bull this past week.
However, this bearishness will likely correct as market regulation clarifies itself and persisting crypto narratives increasingly parrot “digital gold”, “be your own bank”, “lessen your vulnerability to bank bail-ins”, “institutional infrastructure” (ETFs and pensions) and the myriad of shitcoin narratives (“defi, NFTs, gamefi, decentralized social media/storage”), likely overpowering investor trepidation in an increasingly unstable environment (economically, socially, politically), where non-institutional and institutional investors seek fresh memes, dreams and alternative emerging asset classes outside the traditional economic purview, to cope with an increasingly negative worldview.
Also note the recent dovish FED meetings and the reflection of ~4 25bp rate cuts implied by US rate futures; perhaps a cosy foreshadowing of a 2024 BRRRRRRRRRRRRR printing session to help bulls march onwards.
Targets:
Dec 2024 $500m market cap
March 2025 $1.5bil market cap
Dec 2026 $2bil market cap
DISCLAIMER: The above is educational/entertainment, not financial advice.

#LSK Looks Cool for SPOT holders also for Mid/Long terms gains LSK Looks Cool for SPOT holders also for Mid/Long terms gains ✅
If you are a spot trader then you can add LSK in your bags 🚀
Rounding Bottom below the Key Zone on weekly Timeframe 🧐
770 Days of accumulating and now we are ready to break out🚀

LSK good opportunityALl you need is in analysis.
Return from the fibbo zone and increase to the fibbo extension lvl 2. All this after a deep correction on BTC over the next 2 months.

Lisk L2 comming...Lisk announced migration to L2 Ethereum OP Superchain... This year promise be interesting for JSE:LSK

please pay attentionAll the rise that was made is only the fourth wave, as this is a corrective rise, not a motive, and a fifth, final downward wave is expected.

#LSKUSD - Stuck Under Descending Trend Line, Poised for Decline✅ Hey Guys
The price of #LISK recently has shot up to reach the historic descending trend line which has been tested and rejected to the downside.
There's a couple layers of support here at around 13% and 20% respectively, this be our target!
____________________
What Do You Think?
If you enjoyed or agree with this idea - drop us a comment, like & follow! 😀
Ideas by theCrypster meet the guidance notes and disclaimer as mentioned below and within our website. See Signature for more info! ✌️
🔥🔥🔥
Crypto Tipster v2
theCrypster
🔥🔥🔥

LSK with potential to the last levelAfter reaching the level of 786, we book the expected price slide, which is also visible on the RSI indicator. I expect that for a few more days we will sit at rating levels of +/- a few percent and we will move from this place to $2, where we will achieve another mid-order correction in anticipation of reaching higher price levels, but there will still be time to analyze these levels
Last analizes:

#LSKUSD - A Break Down Through Zone Would Indicate Large Bears!theCrypster -
#LISK has just pulled off a massive trade for us, over 30% on it's most recent long trade - and now we're going Short off the upper resistive trend line.
If we can push down through this current level of potential support (highlighted within the blue box) we could be seeing Short profits of up to 45% if we get close to the lower-most support!
There should be plenty of opportunity to TP on this at various levels as you wish!
If you enjoyed or agree with this idea - drop us a comment, like & follow! :)

LSK does not slow down and is preparing to break the topLSK plays the classic move further towards the fibbo extension. Levels visible and marked in the analysis. The only threat for us may be a decrease in BTC, but I think we'll make it before that and LSK will reach the planned level. Green more likely, yellow the least but possible

LISK Coin is Risky? maybe notLisk coin is long and historical coin
it will go somewhere at april and july
before chart ....i think it is almost same

LISK LSK USD : DESCENDING WEDGE AND EXPANDING WEDGE $360 TARGETLISK looks like its primed to take off. Ive done a couple other charts on coins that are proof of stake. I did this because the USA government is going to address the issue of proof of work and the massive energy consumption. I believe proof of work is something that will fade away in the near future, its just not Green in the eyes of the government. Proof of stake or some other method will take over. I believe proof of stake coins will be the next big market pump. Something big has to happen for a move like this to play out but its very possible, especially considering LSK did a 40,000% rise in a fairly short period of time. Even at $368 per LSK the market cap would only be around 50 Billion. LSK could surprise everyone! it could however break to the downside and a measured move would bring it to about a penny. I lean more towards the bullish side!
This is not financial advice just my opinion and what I am doing. If you like this content then leave a comment, like, and follow. Thank you

LISK has a descending chartbutterfly harmonic pattern:
X=$0.00084
A=$1023787
AB=0.78 XA
BC=0.38 AB
0.88 XA=$0.01
*1.6 BC=$0.0015
2 BC=$0.000049
*2.24 BC=$0
2.6 BC=$0
*1.27 XA=$0
3.6 BC=$0
*1.6 XA=0

LSKUSD confirmed break-out to $4.50Lisk (LSKUSD) made a critical Triple Break on the current 1W candle as it first broke above the 1D MA200 (orange trend-line), then the Lower Highs trend-line and eventually the 1W MA50 (red trend-line).
When the very same group of levels broke in the past (May 20 2017 and February 03 2020 weekly candles), the price always reached the previous Lower High, which acted as a Resistance. As a result, a solid approach is to buy now on the break-out and target on the medium-term just below the Resistance at $4.50.
Then on the long-term we have to re-evaluate as, even though the Feb 10 2020 1W candle broke above the previous Lower High/ Resistance, it was a fake out and got rejected slightly above it. Of course it has to be said that this was the time of the start of the COVID crash. In any case, a break above the Resistance doesn't guarantee a long-term rally.
--------------------------------------------------------------------------------------------------------
Please like, subscribe and share your ideas and charts with the community!
--------------------------------------------------------------------------------------------------------


LISK usd W-time frameinverted head and shoulder
uptrend channel
double bottom spotted
higher highs
price will find resistance at 40 dollar.

$Lisk approaching a critical mass eventAt first blush there seems to be a lot going on here but spend just a minute to examine the trend lines and thier origins. They're showing you where we'll find support on a bearish move, or resistance on bullish move, far into the future. This is a weekly scale, log chart.
Fundamentally, Lisk hasn't been the most exciting blockchain project. However, what they have going for them is consistent development, a low bar for entry to devs already very familiar with JS and a track record of relentless development and sound business practices.
Technically this chart *strongly* favors bullish continuation. A target #1 at $10.44USD on a bullish breakout of the symmetrical triangle comes with a healthy R/R at about 5.5. This target #1 also coincides with a D completion on a bearish bat pattern at that same level. A full send move on strong volatility to a target #2 at only $40 comes with a whopping 18.46 R/R. Both scenarios assume a stop loss set at minimum $2.15
In any event, my target is north of $100- then things start to get interesting. Good Luck!

butterfly scenariobutterfly harmonic pattern:
AB=0.78 XA=$11
BC=0.88 AB=$0.65
tp1=0.88 BC=$8
tp2=0.88 XA=$16
tp3=1.6 BC=$63
tp4=2.24 BC=$367

$1.97 is dreamy entry pointcrab harmonic pattern:
AB=0.38 XA
BC=0.88 AB
0.78 BC=$1.97
0.88 BC=$2.33
1.6 BC=$8.18
2 BC=0.78 XA=$15.74
2.24 BC=$23.73
0.88 XA=$24.71
2.6 BC=$45.32
1.13 XA=$74.28
1.27 XA=$140.92
3.6 BC=$250.97
1.41 XA=$262.58
1.6 XA=$670.88
4.23 BC=$722.75

660% incoming for Lisk-usdlisk seems to bottom out in this rising bullish channel
found support at 2.15 dollar
will most likely hit 1.618 fib
total2 looks good to
use good risk reward and only invest what you can 'afford' to lose
lets kill 2022 ;)

7.5 dollar liskusdbullish structure
total2 breaking up higher
btc.d falling
inflation going up
4.6 dollar resistance , break out = bullish
