LSKUSDT(Lisk) Daily tf Range Updated till 06-03-24LSKUSDT(Lisk) Daily timeframe range. pumped when everything else dumped within liquidity clean up thats actually impressive. 3.259 holding strong for now. it needs to keep above 2.162 to try again there. 2.162 is recent retrace point below that will need more fuel later to move up.
LSKUSDT trade ideas

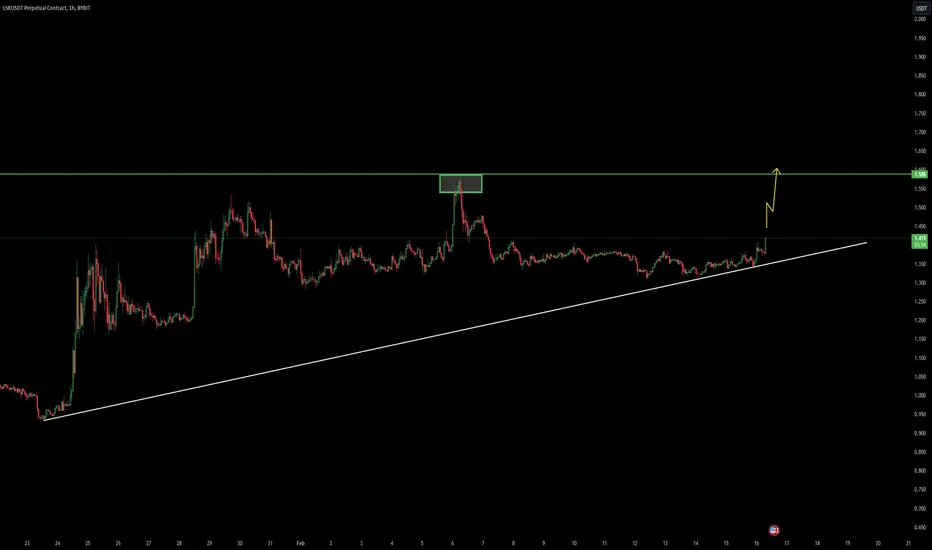
LSK LOOKS BULLISHIt looks like a big triangle is finished. It is expected to move towards the targets while maintaining the green range
The targets are marked on the chart.
Closing a daily candle below the invalidation level will violate the analysis
For risk management, please don't forget stop loss and capital management
Comment if you have any questions
Thank You

LSK NEW INCREASE VOLUME Thank you for reading this trend update.
LSK: USDT showing a new volume trend what can bring this coin in the next time frames into confirmation of the trend?
We will follow the coin to see if it's able to confirm.

XABCD PATTERN this is idea for personally recommending. i think tis very long terms invast so long i entry for tomorrow now this is look like is amazingly patterns.It's X pattern charter.

LSK VOLUME INCREASEThank you for reading this update.
LSK seems to start new volume trend what could get a confirmation in the coming time frame.
I Cannot Short This !!! situation+next targets.Hi.
COINEX:LSKUSDT
-has formed a bullish pennant pattern on the 4-hour timeframe.
-A breakout above descending resistance could lead to a pump higher🚀
_ _ _ _ _ _ _ _ _ _ _ _ _ _ _ _ _ _ _ _ _ _ _ _ _ _ _ _ _ _ _ _
✅Thank you, and for more ideas, hit ❤️ Like ❤️ and 🌟 Follow 🌟!
⚠️Things can change...
The markets are always changing and even with all these signals, the market changes tend to be strong and fast!!

LSK/USDT IF breakout is success. Pumping is coming for the LSK!💎LSK has recently displayed significant market dynamics, with a notable upward movement leading it to confront the bearish OB and supply area.
💎 Historically, LSK has faced strong rejection when approaching the Bearish OB area. However, if it manages to break out of the supply zone successfully this time, it could trigger a bullish momentum.
💎 In such a scenario, the price may experience a significant upward movement, probability of reaching our target strong resistance area.
💎 Conversely, if LSK fails to break out of the supply zone, the price is likely to be rejected and move downward toward the demand area at 1.3, where it could establish new momentum. When the price reaches the demand area, it must bounce if there is an intent to resume an upward trajectory and attempt a breakout.
💎 Failure to bounce or a breakdown of the demand area would be considered a negative sign, potentially leading to continued upward movement, with the next potential stop being the Bullish OB area.
💎 The Bullish OB area holds significant importance, and a successful bounce from this level, along with reclaiming the price above the demand area, would be essential for LSK to maintain its bullish stance. However, if this scenario fails to materialize, LSK may lose the Bullish OB area and continue its downward movement, potentially heading further south.

LSK long trade Here is an asset showing strong bullish divergence after breaking above a critical level. This one should have a good run up depending on the price action of citcoin. 3 targets shown on the chart

LSKUSDT- MOVE IN A BULLISH TRENDLSKUSDT-
To take a ride of a bullish trend here I can come up with a proper analysis.

LSK pump??LSK has a bullish flag pattern on 4H Time frame, we expect a good pump in the case of breakout..🚀

LSKUSDT.PHM signal v3.0 (High momentum) spotted. Looking good with previous wave up with increasing volume and momentum.
- Heathy retracement and support well at good level @ 1.361-1.372
- Trending slow and steady if able to hold above the support zone
It is at extremely good reward to risk level now if able to hold above the support level.

$lsk perps listing play
needs to reclaim mid range or white line to get going
for now at 7 ema on daily so nibbled on some will add closer to 938 IF given
invalidation below range targeting $2.679ish

LSKUSDT.PLSKUSDT.P is in bullish trend.
Bearish divergence alsoo form in RSI.
Rising wedge reversal pattern also form.
this strongly indicates that the trend will reverse from here.
We wait and watch for the breakdown of last HL.

LISK LSK Coin Price Prediction🔥 Price on the 4H chart might come at these support area and we might get a potential bounce🔥
Potential bounce areas for Buying 1.238
👉 Follow me for More Real Time Opportunities.
Share your Thoughts if you have any?

LSKUSDT 🟢🔔 Signal: BUY
Asset: LSKUSDT (LSK)
📈 Technical Analysis:
LSKUSDT (LSK) is presenting a strong BUY signal as the price touches the 200-day moving average and experiences a bounce from the 78.6% Fibonacci retracement level, indicating a potential bullish reversal.
📊 Trade Details:
Entry Point: Current market level (Touching the 200-day moving average and bouncing from 78.6% Fibonacci) "≈$1.0"
Target 1: $2.3
Target 2: $2.98
Target 3: $4.0
📈 Trade Analysis:
The touch on the 200-day moving average and the bounce from the 78.6% Fibonacci retracement level suggest a strong bullish sentiment for LSKUSDT (LSK). The price targets of $2.3, $2.98, and $4.0 present lucrative profit opportunities as the bullish reversal unfolds.
💡 Risk Management:
Only use 5%-10% of your capital for this trade to mitigate risks.
Avoid going ALL IN on trades, even if you're confident they will succeed.
Do not invest your full capital; it's important to diversify and manage risk exposure.
Consider setting a stop-loss at an appropriate level to protect your investment by regularly monitoring and adjusting levels as needed.
Successful trading requires patience. Allow the trade to develop and avoid impulsive decisions.
🔄 Additional Buy Zone:
Be prepared to identify and utilize another buy zone if market conditions require it. Flexibility is key in adapting to changing trends.
⚠️ Spot Trading vs. Futures:
Spot trading is a safer and more controlled approach, allowing for better risk management compared to the higher volatility and speculative nature of futures trading.
Exercise caution and consider the potential risks associated with leveraged instruments.
🚨 Disclaimer:
Trading involves risks, and past performance does not guarantee future results. Exercise caution and conduct your research before making any financial decisions.

Lisk LSK Coin Price Prediction🔥 Price on the 4H chart might come at these support area and we might get a potential bounce🔥
Potential bounce areas for Buying 1.586 and 1.455
👉 Follow me for More Real Time Opportunities.
Share your Thoughts if you have any?

LSK ANALYSIS🔮#LSK Analysis : Pattern Formation 💰💰
📈📈 #LSK is making perfect "Double Bottom Pattern". If #LSK breakout the neckline and also retest the level then we will see a bullish move.💲💲
🔖 Current Price: $1.300
⏳ Target Price: $2.729
⁉️ What to do?
- We can trade according to the chart and make some profits in #LSK. Keep your eyes on the chart, observe trading volume and stay accustom to market moves.💲💲
🏷Remember, the crypto market is dynamic in nature and changes rapidly, so always use stop loss and take proper knowledge before investments.
#LSK #Cryptocurrency #DYOR

LSKUSDTI have taken a Long position on LSK, and this is my own idea. This trade is executed on Binance.

LSK/USDT - Lisk: Super Trend◳◱ On the $LSK/ CRYPTOCAP:USDT chart, the Super Trend pattern suggests indications that the trend may be gaining or losing strength. Traders might observe resistance around 1.259 | 1.319 | 1.43 and support near 1.148 | 1.097 | 0.986. Entering trades at 1.184 could be strategic, aiming for the next resistance level.
◰◲ General info :
▣ Name: Lisk
▣ Rank: 258
▣ Exchanges: Binance, Kucoin, Huobipro, Gateio, Bittrex, Hitbtc
▣ Category/Sector: Infrastructure - Application Development
▣ Overview: Lisk is a blockchain application platform. Based on its own network and utility token LSK, Lisk aims to enable JavaScript developers to build blockchain applications and deploy their own sidechain linked to the Lisk mainchain, including a custom token. The network is operated using the Delegated Proof of Stake (DPoS) consensus algorithm.
◰◲ Technical Metrics :
▣ Mrkt Price: 1.184 ₮
▣ 24HVol: 2,057,948.877 ₮
▣ 24H Chng: 3.86%
▣ 7-Days Chng: -5.06%
▣ 1-Month Chng: 0.51%
▣ 3-Months Chng: 56.75%
◲◰ Pivot Points - Levels :
◥ Resistance: 1.259 | 1.319 | 1.43
◢ Support: 1.148 | 1.097 | 0.986
◱◳ Indicators recommendation :
▣ Oscillators: BUY
▣ Moving Averages: BUY
◰◲ Technical Indicators Summary : BUY
◲◰ Sharpe Ratios :
▣ Last 30D: 0.39
▣ Last 90D: 2.49
▣ Last 1-Y: 0.61
▣ Last 3-Y: 0.43
◲◰ Volatility :
▣ Last 30D: 1.00
▣ Last 90D: 0.79
▣ Last 1-Y: 0.75
▣ Last 3-Y: 1.12
◳◰ Market Sentiment Index :
▣ News sentiment score is N/A
▣ Twitter sentiment score is 0.43 - Bearish
▣ Reddit sentiment score is 0.73 - Bullish
▣ In-depth LSKUSDT technical analysis on Tradingview TA page
▣ What do you think of this analysis? Share your insights and let's discuss in the comments below. Your like, follow and support would be greatly appreciated!
◲ Disclaimer
Please note that the information and publications provided are for informational purposes only and should not be construed as financial, investment, trading, or any other type of advice or recommendation. We encourage you to conduct your own research and consult with a qualified professional before making any financial decisions. The use of the information provided is solely at your own risk.
▣ Welcome to the home of charting big: TradingView
Benefit from a ton of financial analysis features, instruments and data. Have a look around, and if you do choose to go with an upgraded plan, you'll get up to $30.
Discover it here - affiliate link -

#LSK More Than 50 % PUMP Loading.. !! OM NMAH SHIVAYE !!
#LSK More Than 50 % PUMP Loading.. #LSK has big bulls , it can touch upside box ..
NAMASTE !!

LSK| Is a correction after growth inevitable?Hello trader! Today I have a new idea for you. Like and subscribe to the channel, there is a lot of useful information there.✅
A corrective movement has already begun on this coin; you can try to enter from the current ones with a small gain higher.
Deal plan:
Entrance - 1.050/1.082$
Stop - $1.150
Take - $0.940
Guys, be sure to follow the risks, the coin can show strong volatility in the moment, be careful!


finally lisk getting ready for breakout in downtrend since 2021 and seems like has already bottomed out formed falling wedge in 3 days and building up for massive breakout
incase of successful breakout expecting 200 to 220% bullish rally in midterm
keep eyes on lsk for breakout keep in mind without confirmed breakout do not buy
