TEM $60C Lotto Play Before Earnings?🔥 **TEM \$60C Lotto Play Before Earnings?**
**Volatile Setup with 100%+ Upside Potential 🎯**
---
### 📈 **Trade Summary:**
* **Direction:** CALL (LONG)
* **Strike:** \$60.00
* **Entry:** \~\$2.20
* **Target:** \$4.40 (100%+)
* **Stop Loss:** \$1.10
* **Expiry:** Aug 08, 2025 (1DTE)
* **Confidence:** 65%
* **Risk Size:** Max 2% of capital
* **Gamma Risk:** 🔺 HIGH
* **Volume:** ⚠️ 0.8x prior week
* **Call/Put Ratio:** 1.34 (Bullish Flow)
* **RSI (W/D):** 52.2 / 49.0
---
### ⚠️ Key Takeaways:
✅ Bullish bias from RSI + Options Flow
❗ Weak volume and earnings risk = caution
⚡ 1DTE = high gamma, faster decay
🎲 Pure lotto? Size small, manage tight
---
### 🧠 Verdict:
**If you're playing it — play it tight.**
High reward, high risk. Treat it like a lotto ticket with a defined edge.
A40EDP trade ideas

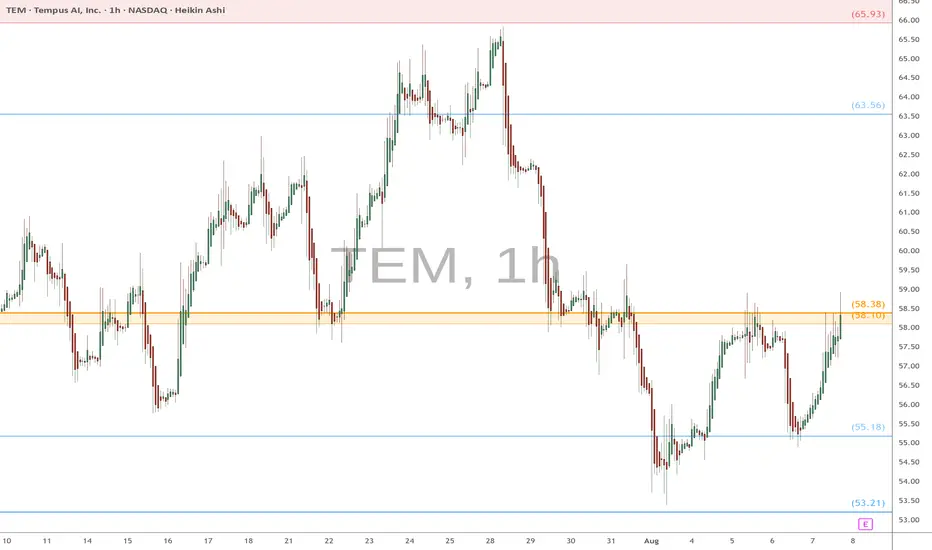
TEM eyes on $58.10/38: Double Golden zone about toe BREAK?TEM is trying to paint a bottom to its downtrend.
Look for break of Double Golden zone $58.10-58.38
Zone is well proven to all traders so watch it closely.
TEM WEDGE Tem's in an interesting position. Multiple bullish and bearish gaps on the daily chart, wedging and tight consolidation, and head and shoulders that indicate a possible bearish continuation. Worth watching.

LONG | TEMNASDAQ:TEM
I’m leaning bullish on $TEM. Today’s volume came in around 2.5× the 20-day average, paired with a bullish engulfing candle—both strong short-term momentum signals. Price is testing the multi-month descending trendline, with $68.43 as the breakout trigger. A close above that opens the path to $72.15 → $74.20. The largest volume profile node sits in the $60–62 zone, making $62 my key support; losing it would shift bias to neutral/bearish

TEM: Bought Some Calls HereLooks pretty good at the demand zone, finding buyers and volume. Watching the next move. Thanks for reading.

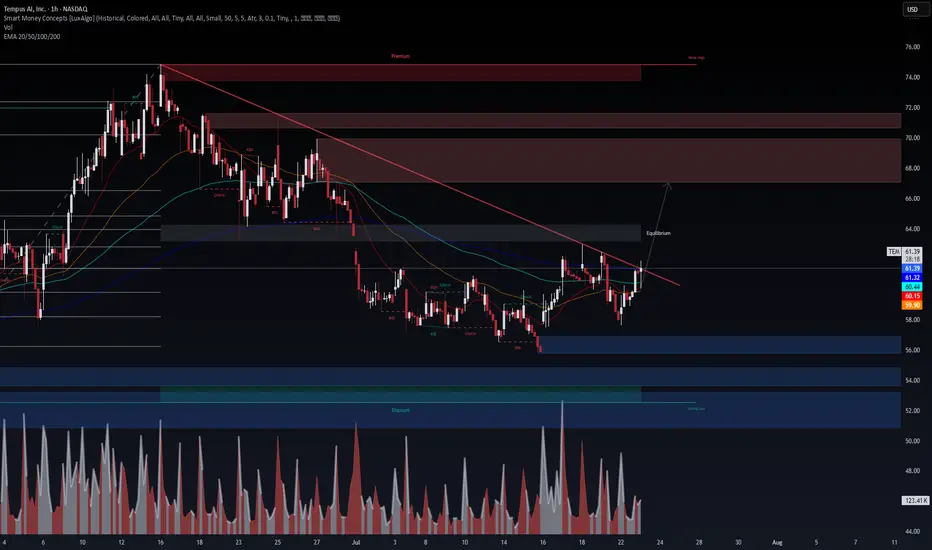
$TEM – Breakout Imminent After Accumulation? NASDAQ:TEM – Breakout Imminent After Accumulation? 📈
Tempus ( NASDAQ:TEM ) is flashing strong bullish signals backed by smart money and confirmed option flow.
🔹 Technical Picture (1H)
Trendline just broken to the upside
Clean break of structure (BOS) after sweep of June/July lows
Volume spike + EMA realignment confirms momentum shift
Targeting the $66–$70 equilibrium zone short-term
High timeframe liquidity sits above $74 — a magnet if momentum continues
🔹 Options Flow (July 23 @ 6:54 AM)
$56K call sweep for Aug 1 $66C (To Open)
Smart money positioning for a rapid move higher — not retail-driven
🔹 VolanX Bias: Bullish
Long trigger confirmed on trendline break and BOS
Risk: < $59.50
PT1: $66
PT2: $70
PT3: $74+ (if volume sustains)
This is now on VolanX watchlist as a potential stealth breakout fueled by institutional flow.
⚠️ For educational purposes. Not financial advice. VolanX Protocol active.
#TEM #Breakout #OptionsFlow #SmartMoney #VolanX #TradingView
TEM – Bullish Continuation to $74+ | Institutional Catalyst fromTEM – Bullish Setup Targeting $74+ | Strong Institutional Backing
VolanX DSS, WaverVanir AI, and SMC confluence confirm a STRONG BUY signal for TEM, with a 15–20% upside potential over the next 30 days.
Key Highlights
AI Forecast:
Current Price: $64.49
30-Day Target: $74.56 (+15.6%)
Model Confidence: Strong Buy
Technical Confluence:
Price has reclaimed equilibrium and is holding above EMA 20/50/100.
Fib levels and channel support point to an upside breakout towards $74–75.
Breakout of $66.3 (0.618 fib) would confirm bullish continuation.
Institutional Catalysts:
Recent Russell 3000E inclusion and increased institutional ownership.
Strong partnerships (AstraZeneca, Pathos AI) and expanding AI-driven healthcare initiatives.
Upgraded 2025 financial outlook.
Trade Plan
Entry: $64.50 (current levels)
Stop Loss: $56.96 (below EMA 100)
Target 1: $65.78 (partial)
Target 2: $74.56 (full)
Risk/Reward: 1.34:1
VolanX Protocol Insight:
Both the AI forecast and technical structure suggest continuation of the bullish channel. A clean breakout above $66.3 opens the door to $74+, with a potential extension towards $80.

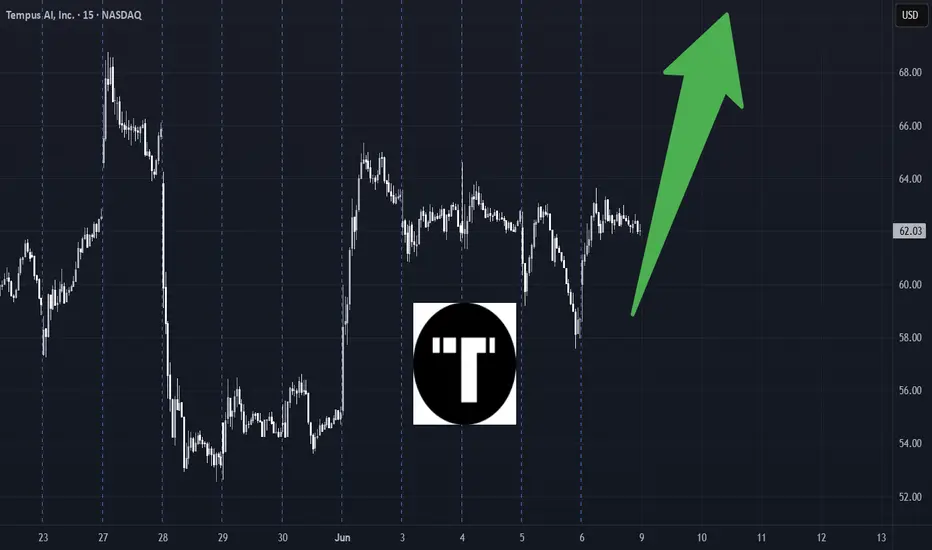
TEM - what do you see ?I love this stock, so much momentum and good follow through.
I see it's ready for a strong rally. I've huge position via shares and Aug calls

Tempus AI getting some firepowerLooks like we have got support here at $57 area. MACD looking good and overall structure points to further upside. First target $69. If it pushes through then final target $78.


$TEM - New ATH's Inbound! 50% UpsideNASDAQ:TEM - New ATH's Inbound! 🚀
Bull Flag Breakout = $84.17 🎯
74.20 Cup&Handle Breakout = $110 🎯
WCB forming 📈

$TEM to $100Target $100 this summer. Price is breaking out with a nice volume. $72 level is the main level to watch. Once we clear $72, $100 range is doable

TEM Weekly Options Play – 2025-06-10🧾 TEM Weekly Options Play – 2025-06-10
Bias: Moderately Bullish
Timeframe: 5 trading days
Catalysts: Positive fundamentals, stable macro, bullish option flow
Trade Type: Single-leg CALL option
🧠 Model Summary Table
Model Direction Strike Entry Price Target Stop Loss Confidence
Grok Bullish 63.00C $2.45 $3.68 $1.72 65%
Claude Bullish 65.00C $1.70 $3.00 $0.85 72%
Llama Bullish 63.00C $2.30 $2.76 $2.07 70%
Gemini Bullish 68.00C $1.05 $2.00 $0.50 65%
DeepSeek Bullish 63.00C $2.40 $4.80 $1.20 70%
✅ Consensus: Moderately Bullish
📈 Core Setup: Trend continuation after short-term consolidation
⚠️ Outlier: Gemini sees breakout only above $68, targeting aggressive upside
🔍 Technical & Sentiment Recap
Trend: Daily uptrend intact across all models; short-term consolidation on 5m
Momentum: Mixed MACD and RSI readings—daily bullish, short-term still cooling
Sentiment: Falling VIX + positive earnings/news cycle favor upside
Options Flow: Max pain at $62 provides cushion; calls dominating OI above $63
✅ Final Trade Recommendation
Parameter Value
Instrument TEM
Strategy Weekly naked call
Strike $65.00
Entry Price $1.80 (ask)
Profit Target $3.00 (~67% gain)
Stop-Loss $0.90 (~50% risk)
Size 1 contract
Entry Timing At market open
Confidence 72%
🎯 Rationale: $65 call offers balanced leverage, high open interest (799), and aligns with Claude’s mid-week breakout thesis. Models converge on a bullish lean with manageable risk-reward.
⚠️ Risk Factors
5m chart bearish MACD may delay breakout
Price may hover near max pain ($62) early in week
Unexpected legal or macro news could reverse sentiment
Liquidity risk in thin spreads—use limit orders for entry/exit
📊 TRADE DETAILS SNAPSHOT
🎯 Instrument: TEM
🔀 Direction: CALL (LONG)
🎯 Strike: 65.00
💵 Entry Price: 1.80
🎯 Profit Target: 3.00
🛑 Stop Loss: 0.90
📅 Expiry: 2025-06-13
📏 Size: 1 contract
📈 Confidence: 72%
⏰ Entry Timing: open
🕒 Signal Time: 2025-06-08 16:04:57 EDT
TEM eyes on $58: Double Golden fibs and obviously STRONG zone TEM has fallen to a Double Golden fib zone.
$58.10 is a Golden ratio of Top down wave.
$58.38 is a Golden Genesis fib (bottom up).
Key level here and a Do-or-Die for bulls.
=====================================
Previous Analysis that caught a bottom nicely
========================================
.

$TEM - GET READY! 30%+ UpsideNASDAQ:TEM - GET READY!
✅ Inverse H&S Breakout
✅ Falling Wedge Breakout
🎯 Targets: $77.43 & $90.63 Before August!

TEM W pattern + base breakout setupMany of the beaten down tech stocks and ai stocks have this same look. Big basing patterns with a W bottom where clear ranges are being formed for a break of the lid.
Thinking entry here in the 56 range with a stop under todays low shoud get a good entry for the breakout here. NASDAQ:TEM

$TEM has a great symmetry Great Fib channel on tem. It respected the lowest trendline now we wait on the rest!

TEM eyes on $50 round: Key fib and psych level to breakTEM trying to recover along with the general market.
Testing a key fib Zone and psych val $50.01-50.27
Look for break and retest for blue skies above.

TEM Weekly Analysis Summary (2025-04-16)TEM Weekly Analysis Summary (2025-04-16)
Below is a consolidated view of the reports along with areas where they agree and differ, followed by a clear trade idea.
──────────────────────────
SUMMARY OF EACH MODEL’S KEY POINTS
• Grok/xAI Report
– Notes that although the daily trend is bearish, the 5‑minute chart shows bullish signals (RSI rising, MACD crossed up, price above the 10‑EMA) and key short‐term support around $40.
– Recommends buying the $41.50 call (despite its premium being slightly above the “ideal” range) to capture an anticipated move toward the max pain at $44.50.
• Claude/Anthropic Report
– Stresses that on daily timeframes price is in a strong downtrend with clear bearish momentum—but short‐term indicators (like a modestly improving 5‑minute RSI and MACD) suggest that downside may be softening.
– Leverages the heavy put open interest (especially at the $40.00 level) and overall support to recommend a bearish play by buying the $40.00 put.
• Gemini/Google Report
– Emphasizes short‑term technicals: the 5‑minute charts show a bounce potential using RSI, MACD crossover, and positive news (partnership catalyst) combined with falling VIX.
– Recommends a moderately bullish, counter‑trend trade using the $42.50 call (ask ~$0.50) as a short‑term bounce play aiming to reach the $42+ area.
• Llama/Meta Report
– Also lays out a mixed picture. Although the short‑term charts show hints of a rally, it notes the daily chart remains bearish.
– Leans toward a put option side (buying the $40.00 put) given the attractive premium and strong support at $40.
• DeepSeek Report
– Finds that while the very short-term (5‑minute) indicators have begun to turn positive, the overall daily picture remains in distress and the max pain level is much higher.
– Concludes “no trade” is best until direction is clearer, though it does sketch alternate setups for either a call or put trade if forced.
──────────────────────────
2. AREAS OF AGREEMENT & DISAGREEMENT BETWEEN MODELS
Agreements:
• All reports recognize that the current price is near crucial support around the $40 level.
• There is agreement that the 5‑minute charts are more bullish than the daily charts, which remain in a downtrend.
• Technical indicators (RSI, MACD on the intraday chart) hint at an intraday or end‑of‑day bounce even if the longer‑term bias is weak.
Disagreements:
• Grok/xAI and Gemini/Google favor a short-term bullish/counter‑trend bounce via call options.
• Claude/Anthropic and Llama/Meta emphasize the dominant daily bearish structure and would favor a put option to capture further downside.
• DeepSeek remains on the sidelines overall—indicating that the signals are too mixed to pick a clear directional bias without further price confirmation.
──────────────────────────
3. CONCLUSION & RECOMMENDED TRADE
Overall Market Direction Consensus:
While the overarching daily trend remains bearish, a number of models spot actionable short‑term bullish clues (rising 5‑minute RSI/MACD crossover, positive news catalyst, falling VIX) that suggest a possible intraday or early session bounce. With the price near strong support (~$40) and max pain at $44.50 offering a potential upward target by expiration, a short-term counter‑trend call trade is justified for the weekly options.
Recommended Trade:
• Trade: Buy a single‑leg naked call option.
• Option: TEM $42.50 Call (Weekly expiry 2025‑04‑17)
• Premium: Ask is $0.50 – comfortably within our favored range.
• Rationale: The trade banks on a short‑term bounce off key $40 support with the expectation that positive technical momentum and catalyst news may lift the price toward the $42+ area. (While the daily trend is bearish, the intraday indicators and market news support a careful, short‑term bullish view.)
• Entry Timing: At open.
• Profit Target: Approximately $0.80, roughly a +60% move on the premium.
• Stop‑Loss: Set at $0.25 (~50% loss on premium) to limit risk.
• Confidence: About 65% given the conflicting longer‑term vs. short‑term signals.
• Key Risks/Considerations: Should the price fail to hold support near $40 or if intraday momentum reverses suddenly, the call trade will likely suffer. The inherent counter‑trend nature of the play means disciplined stop‑losses and risk management are essential.
──────────────────────────
4. TRADE_DETAILS (JSON Format)
{
"instrument": "TEM",
"direction": "call",
"strike": 42.5,
"expiry": "2025-04-17",
"confidence": 0.65,
"profit_target": 0.80,
"stop_loss": 0.25,
"size": 1,
"entry_price": 0.50,
"entry_timing": "open"
}

Tempus AI - LongTempus AI
Technical picture:
- Wyckoff: Large companies accumulation in the form of range with positive delta
- Volume profite: at level of VAL
- Formation: Channel multi-month
- ATR: New monthly low band
- Float: <100M = 78m, providing strong movement potential
Fundamental picture
- Revenue is growing with increasing rate
- EPS is negative but loss is decreasing
Upside: 50%-180%
- Current price - 37
- Market is 55-64-74 (low-consensus-high)
- TA high band is 92 (Resistance line)
- Volume Profile - 67
Downside: 20%
- Market - 55
- Volume profile - 30
Negative aspects:
- Recent sales of stock by insiders but not significant
Exta
- Nensi Pelosi part of the investors


$TEM - MASSIVE Opportunity for this Nancy Pelosi Darling!NASDAQ:TEM - Does History Repeat?! 🤯
Same Draw Down could lead to Same Upside!
My target is $100 🎯
Crazy High Risk/ High Reward if we repeat the same timeframe we get in less than a MONTH!!! (Wouldn't count on it, crazy if happens though)
Not Financial Advice

A triangular decline almost a butterfly forming bullish move 65This is a hot stock, technically and catalytically. It is oversold in a consistent buying area, with oscillators curving from the bottom. With gaps to fill in the 60s, there are opportunities.
