LTCETH broke out and people seem to be taking their profitsIt did a breakout, but it didnt seem to capture peoples interest. This may have been a forced breakout to attract buyers. most breakouts in this fashion are Fake Breakouts
LTCETH trade ideas

LTCETH is in up movement soonright now we have diversion between the price and its volume, so the little up movement isn't supported by buying pressure .., soon or later will fall to the demand zone,
on the demand zone it's very good price range to buy

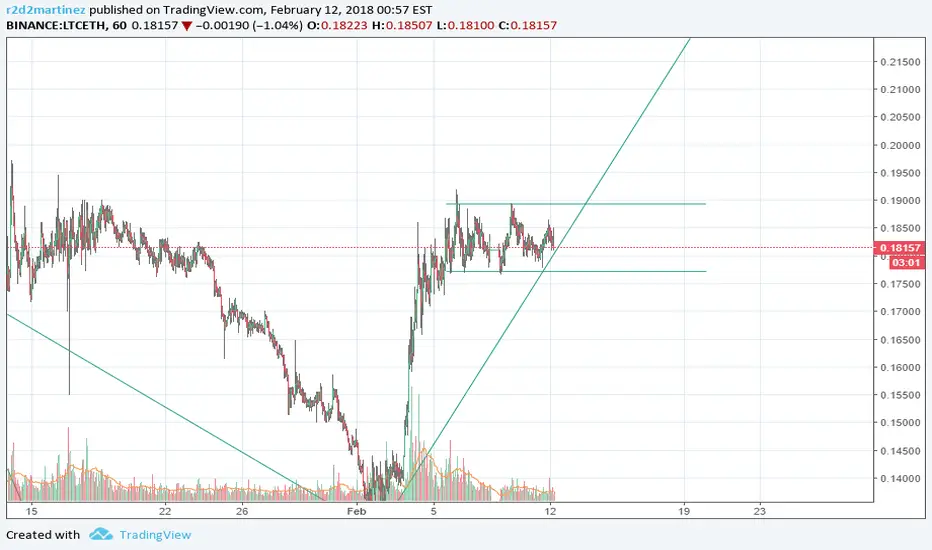
Looks like a Bullish flag so farIt shouldve swung down to the Support but since it didnt thats Good sign #1
Good sign #2 is that the last few candles cant keep their losses, they have long whicks on the bottom meaning Bears tried and tried but Bulls came out and kept closing near the tops. lets see if the Bulls can keep pushing to the top and eventually hopefully it confirms a Breakout.
i will date in 4 hours. Today im going to organize everything so i dont randomy keep posting ideas and forget about
them

i forgot to draw that line on the last one :)which everer timeframe ur looking at. i was looking at 5 min so i was looking at short term butit wouldnt let me post on 5 min so had to switch to 15 min and that analysis is different

its not rocket science people, it was going one way now its....going the other way until it stops going that way, and when it does you know because ittl either break the Support or stop making Higher Highs and Higher Lows.
You Draw Some Support line
you draw some Resistance lines and let the trend go, it will tell u if its weak or strong by the amount of higher highs and higher lows getting larger or smaller and will tell you its consolidating when it stops making higher Highs, but until it makes Lower High assume its still trending up and consolidating if going sideways due to profit taking


i want it to go up but unfortunately its going to come back downthe gains are way to weak, they went up on low volume and all the candles have a big wick on top, meaning they cant keep any of their gains.

time to buy litecointhree black crows candles( sign for probably bearish ) if rsi indicator goes down under level 30 and then returns and breaks level 30 it will be the time to buy Litecoin, if it goes down towards level 10 it will be the best time to buy litecoin


Litecoin tomorrow big dayI really think tomorrow we could se a breakout in LiteCoin/Ether chart, the actual pair is stable, time to buy LTC,
Just an opinion, thanks.
LTCETH ascending triangle - target 0.3Soon after the triangle is completed, it looks like breaks out to the upside and makes another measured move to 0.3. This is a similar pattern for LTCUSD as well.


Support/for/ltc/eth/on/binance?Noticing what looks like support building for litecoin on binance. Watch this.

LTC/ETH Buy OpportunityMACD main line and signal line crossed below 0. RSI trending outside of oversold area. Prepare to buy.
