LTC ETH - AnalysisA good risk reward opportunity, on LTC/ETH going long, more details below.
- Entry: 0.2283
- Stop loss: 0.1956
- Target 1: 0.2581
- Target 2: 0.2890
- Target 3: 0.3205
LTCETH trade ideas

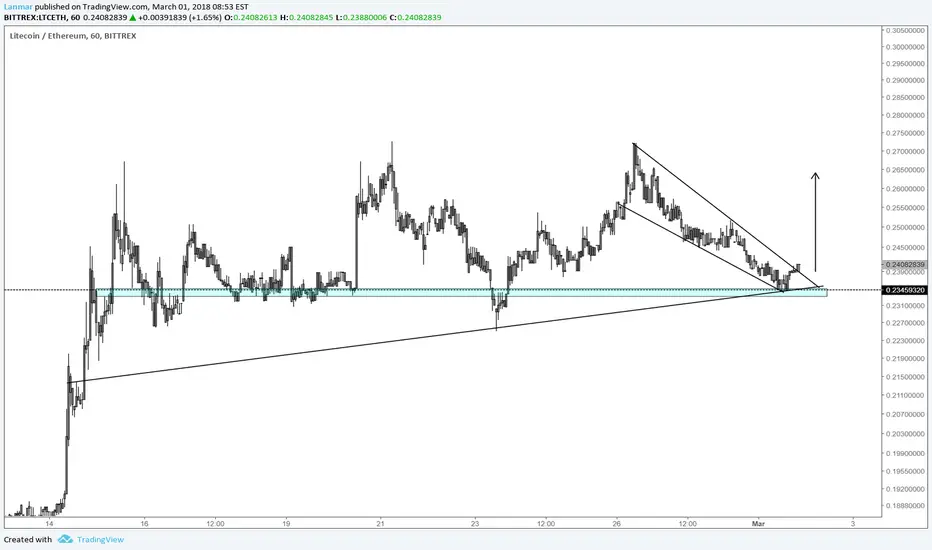
Will LTC repeat Nov - Dec 2017 pattern, and then break out?Descending Triangle nearing end. Likely Bull break for LTC.
If LTC repeats history we will see at ATH in near future, then trace-back to lower levels or maybe upwards to 0.89 Eth.
Concern is Volumes. Not seeing the Volumes coming in yet.
What do you think?

LTCETH - Hidden Bullish Divergence on daily chartLower low in price, higher low in RSI.
LTCETH is making a falling wedge on the daily chart and ready for a bullish breakout.
RSI is coming back up from oversold area and making an ascending triangle.


LTC vs ETH Trade IdeaLTCETH first time trying out an ETH trading pair against LTC. As you can see at the daily, RSI has been at the all-time low and LTC may be ready to bounce back up anytime soon. Litecoin has been lagging behind the market so it may be moving up soon, pulling this trade pair up. Good chance to increase my Ether count, and I don't mind holding LTC either. :)
TP1 at 0.3 ETH
TP2 at 0.4 ETH

LTC/ETH LongType of Trade: Long
Term: Swing
Strategy: Fresh Support test
Resistance level: 0.192-0.165
Type of Entry: 1
Targets: 0.219, 0.246, 0.273
Stop: 0.16
Probability: Medium

No stops for litecoin :C Buyers Waiting and watching!LTC has busted through a major support point, nothing else to expect but a major fall as buyers are not interested just yet! If you're in LTC my sympathies as the bear mask is still on. In hopeful news we're approaching a very strong resistance point, and from such a downtrend we can expect a bounce as buyers wait and watch!
Keep LTC in your thoughts for the coming days and don't miss some great profit! Trust me I travel through time!
Be sure to check my google sheets where I record every idea posted here, you wont be disappointed. Following my signals you can expect 3 things, BIG Wins, Small Wins, Small Losses. A track record of accuracy with proof always provided with complete transparency.
docs.google.com

LTCETH - sell ETH and buy LTCTime is about now - go long on LTC around Fibonacci retracement of 0.5, then ride the wave 3 up to 1.618 Fibonacci extensions.

TIME FOR LTC TO DISPLACE ETH FOR FEW WEEKSLitecoin looking more powerful at the moment, it worth play with as ETh will undergo some correction.
The chart show both entry and exit with sell target

Nice Dip on Litecoin On BinanceGood time to buy!! Quick get on to it before the price goes back to resistance.

LTCETH - breaking outLet's see if the volume is following this breakout ... be happy if you were out from ETH already :)
Target the yellow circle!

LTCETH broke out and people seem to be taking their profitsIt did a breakout, but it didnt seem to capture peoples interest. This may have been a forced breakout to attract buyers. most breakouts in this fashion are Fake Breakouts

LTCETH is in up movement soonright now we have diversion between the price and its volume, so the little up movement isn't supported by buying pressure .., soon or later will fall to the demand zone,
on the demand zone it's very good price range to buy

i need a strong push up right about now, keep the momentum goingif you dont pass this Resistance with great volume you disappoint me

Looks like a Bullish flag so farIt shouldve swung down to the Support but since it didnt thats Good sign #1
Good sign #2 is that the last few candles cant keep their losses, they have long whicks on the bottom meaning Bears tried and tried but Bulls came out and kept closing near the tops. lets see if the Bulls can keep pushing to the top and eventually hopefully it confirms a Breakout.
i will date in 4 hours. Today im going to organize everything so i dont randomy keep posting ideas and forget about
them

i forgot to draw that line on the last one :)which everer timeframe ur looking at. i was looking at 5 min so i was looking at short term butit wouldnt let me post on 5 min so had to switch to 15 min and that analysis is different

its not rocket science people, it was going one way now its....going the other way until it stops going that way, and when it does you know because ittl either break the Support or stop making Higher Highs and Higher Lows.
You Draw Some Support line
you draw some Resistance lines and let the trend go, it will tell u if its weak or strong by the amount of higher highs and higher lows getting larger or smaller and will tell you its consolidating when it stops making higher Highs, but until it makes Lower High assume its still trending up and consolidating if going sideways due to profit taking


i want it to go up but unfortunately its going to come back downthe gains are way to weak, they went up on low volume and all the candles have a big wick on top, meaning they cant keep any of their gains.

i need a strong push up right about now, keep the momentumLTCETH, you're my older brother, and I love you. But don't ever take sides with anyone against the Family again. Ever.

LTC/ETH Pair with some interesting actionI won't take credit for this. @carpenoctom on twitter found this gem. Right after the Kumo Twist LTC is out pacing ETH and is dead set on going up to that cloud line. Will be fun to see how this plays out.


Litecoin vs Ethereum: Key reversal zone on hourly chart Litecoin has the advantage here to trade higher against ether on an intra-day or short term basis. Medium term+ is TBD.