LTC back to $40 - $60?The image explains itself. Although it’s in euros, the behaviour is the same.
I have to say I haven’t got any LTC and not planning to buy anything, so I’m not biased at all.
It’s just an idea of what it could happen to LTC. Take your own risk when investing. I’m not responsible of your actions.
As you can see in the previous pump that I have circled in red, everything that goes up, has to go down, and I’ve seen a lot of posts saying it will going up.
To be honest, it’s a possibility, but use your common sense and don’t think it’s always going up, since it has to go down one day and “land” again. Once it “lands”, it has to run through the “runway” to go up again.
That said, I think it will go down, touch the bottom after some small or acceptable pumps, and wait for people’s fear to stabilise.
It’s a correction, but not the end.
Again, trade at your own risk. I will not be responsible of your actions.
LTCEUR trade ideas


Initial Idea using Elliot Waves (daily) - EUR Initial Idea using Elliot waves adjusted. Potential time to buy on 2nd wave.
Is one of my first published idea, let me know what you think.
I've adjusted the bottom of the 2nd impulse a couple of time so is just a maybe, but this has potential.

just as expected ... LTC hit the first resistance zonestep 1 was spot on, let's see if it goes to 2 or directly to the top of the channel .... or to " a " for a small correction. it all depends on BTC

same as brother btc ... LTC about to test the top resistanceboth BTC and LTC are creating a bull flag. if you are not already in, you can get in on the break up with a stop right below the flag.
remember to hit the like
thanks

head and shoulder formationhi guy! the inverted head and shoulders that is forming is a strong inversion signal that can carry the litecoin very high up to 175 €. ended head and shoulders pattern it could have a rebound on the neckline then the breakout followed by a retest of the neckline and then start the uptrend as shown.
* This information is not a recommendation to buy or sell. *

possible head and shoulders formationhi guys! this is my idea about LTC in the next 4-5 days. it's simple and easy to understand.

Rough Idea
Expected drop to 100EUR
Perhaps drop as far as 85EUR
Hike back to 119EUR
Might extend as far as 140EUR

Possible fractal in LTCEUR, more downside coming?
I've noticed a possible fractal pattern in Litecoin, which could lead to a bit more downside.
Starting March 5th until March 9th, we've seen a steep decline, followed by a bounce, creating 3 zones where the price bumped into the same resistance every time, after which we saw an even further decline from March 13th until March 16th.
At the moment, we already have two zones where the price bumps into the same resistance. If we get a small dip to 130 EUR, followed by a bump into the same resistance without actually breaking it, I think we may see Litecoin get closer to the 100 EUR mark than it did last week.
I may very well end up being completely wrong here, since it's my first ever post (so I'm unexperienced), the current situation looks like a bullflag pattern and cryptotwitter is very bullish at the moment. However, when zooming out we are still in a downtrend and the G20 good news feels may start wearing off once people realize that governments not regulating the space this quarter means prolonged uncertainty concerning regulation, which means a clear picture on laws for the cryptomarket is postponed to the next G20 around July. Postponed regulation may lead us to prolonged FUD (Fear Uncertainty and Doubt).
Nothing I post here should be seen as financial advice: trust only yourself and act upon your gut feeling and the charts, since according to John J Murphy "all info available to the market is already worked into the price".


LTC Correction not done yet? It doesn't look like the correction is done yet.
If we consider an expanded flat correction we are now on wave C. According to theory wave C usually is 100% to 165% of wave A. I am not willing to accept yet that LTC will go down to 36 euro (161,8%) so I have drawn the C at the !00% level which is around 83 euro the same level we were on february 6th.
At the moment the chanel for C is pretty clear.
The most logical thing to happen right now would be that the C wave will unfold in a typical 5 wave structure something like i've drawn in yellow. At the moment the ratio's between the waves doesn't point to that. But things change quickly.
Another possibility is that the C wave unfolds as an ABCDE structure. This is wat is looks like at the moment drawn in purple. E wave should, according to theory, finish around the 100 euro.
I've sold my LTC at 129 this morning after catching a nice ride up from 116.
For now it's a no trade zone for me.
By the way I actually hope i'm wrong. Would be great to start an uptrend again.

LTC might enter buy zone soonLTC is currently falling down from the bear flag and is heading towards strong support where it is looking to break up from the bullish falling wedge. RSI is heading towards oversold. A short reversal seems very likely, watch green box and RSI (red circle) very closely. This would be counter trend trading, be careful, we're still in a bear market, this is still a downtrend and the correction is far from over (I expect us to go towards 80 € or lower depending on what BTC is doing)

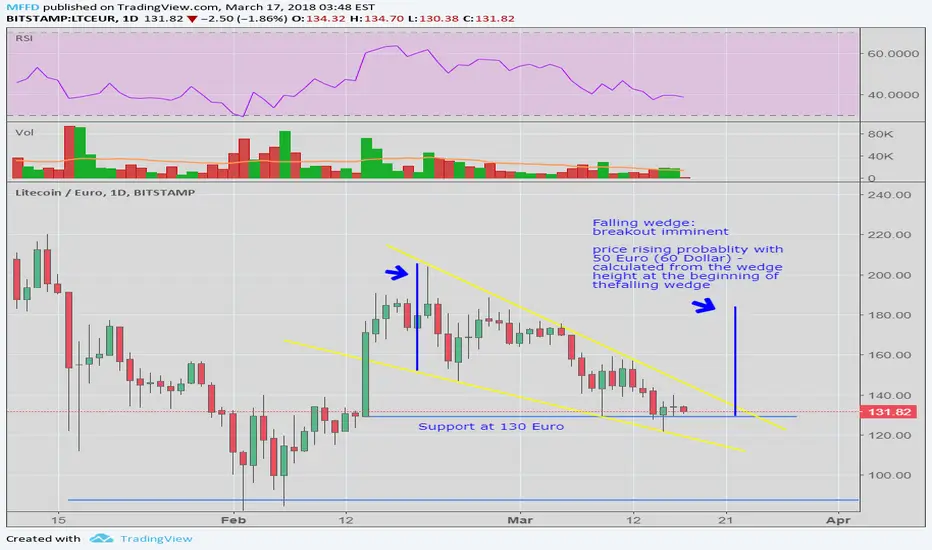
LTC Litecoin Daily pattern - Falling wedge: breakout imminent?On the daily we see a big Falling Wedge pattern arising. The breakout will be soon ... within now and the next 3-4 days very probably. The price will probably rise with an amount of 45-50 Euro (55-62 Dollar) ... assuming that usually the rise at breakout is almost the same as the price difference between low and high price at the start of the wedge.
The current price may still fall somewhat below the support line at 131 Euro, but not much.

LTC EUR Correction target reached. Possible scenarioLTC reached a nearly 65% retracement from the impuls wave that started on februari 2. The low of 121,60 also hit some major resistance zones. Wave C did fall short of 161,8% of wave A that could point to another dip down.
Assuming this correction is done. First target would be around 136 and second target around 157.

LTC/EUR...Double bottomHow are you?
Trading for few weeks now and trying to recognize pattern.
This formation looks like it could end up as a double bottom.
Does anyone agree?

Litecoin bout' to get a whole lot lightersell order for €164 - Buy order €119.5 if the sell order executes.
Rumour has it Mount Gox trustee has 166k bitcoin to sell (market sell)
my pants will be full of litecoin when it hits €1k
cheers to charlie lee & an early retirement

Litecoin to 140 Euros?I'm seeing descending volume on Litecoin and a continuing bearish trend. Next stop possibly 140 Euros.

LTCEURLitecoin looks very optimistic, however, due to Litecoin Cash pump I expect a thorough retracement atleast until Fib 0.618.
There was a clear double bottom for LTC and afterwards a nice pump into a 5 wave structure. It went right up to the point where it last collapsed 15 January shown by the upper red ball. The thick purple line shows that we break through the longer term bearish trend line, therefore I think we are in the correction of the first bull wave.
RSI is bearish down sloping
Buy; from 130 -113 euro (previous bearish trend line)
At the Fib levels, look for reversal trend signs in order to confirm and buy.
Requests for any euro pairs? Let me know in comments!

Mayday Mayday - Litecoin100 EMA held Litecoin bull flag formation
SHORT SIDE
If it breaks to the downside (closes beneath $200) this strongly supports the C wave .....my buy limits are:
€162.87
€156.34
€147.64
€131.24
(Blue Line) 61.8% retracement signaling the next uptrend
LONG SIDE
Breaks the 50% retracement (Green line) we're extremely bullish.....my profit limits are:
€203.42
€221.46
€246.07
€282.98

