LTCEURIf you have shorted your LTCs and it will turn south (look at RSI), here are some areas of interest to get in again.
LTCEUR trade ideas

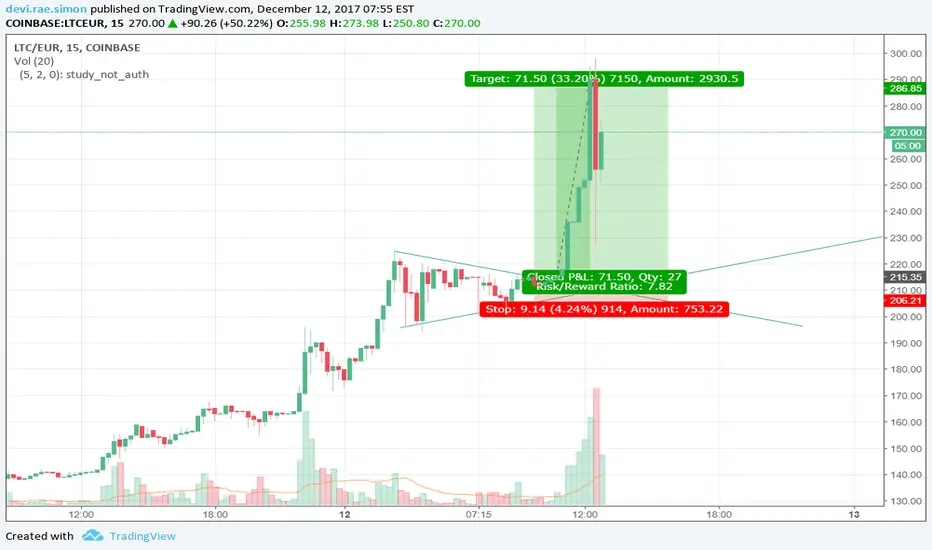
LTCEUR consolidation
After the ultimate bull push, LTCEUR is around 280 with 261 support FIB 50%.
Healthy mode waiting for continuing the overall bullish scenario.

Should I buy now LTC? KRAKEN:LTCEUR
Let's wait about next 2h and see whether my assumptions holds.
Note: this only my personal opinion, not a financial advise.

LTCEUR V shaped correction of full ABC down wave?LTC had done very nicely in past few days, hats down! Congratulation to everyone who entered long few days ago!
Patience is the key. We must wait for pointers in this situation. Price movement is showing complete wave 3, for those waiting the opportunity to go long, I will watch closely 315 EUR level as this 0.382 Fib from last down move from 349 to 260, It should be noted that after initial surge, price bounced of 315 EUR level twice, so this makes this level a little bit more interesting to watch for.
Question is whether price will reveal V shaped correction, and we are going straight up, or we could expect full A-B-C retracement wave. If level of 315 EUR will be strongly broken upwards, then this is confirmation of next bullish move and V correction. On the other hand, movement toward 260 EUR is sign of possible leg C. Moreover, move towards 260 will form double top which is pointer price will possibly go lower.
Chart has some levels outlined. Ranges 386-423 and 487-521 are possible take profit targets measured from both current low at 260 and possible extension of leg C. Levels to watch for in scenario of down movement are 260 (0.382 of latest up move) and 247 (0.382 of whole structure).
Warren Buffett: "The stock market is a device for transferring money from the IMPATIENT to the PATIENT."

Litecoin makes higher high, then drop LTCEUR showed a nice advance in the previous days.
Looks like the run is over for now.
Looking for a higher high to 300 - 325 (distribution), then a drop lower to 225 - 200 (mark down).

my second "hop hop bum idea" named "hop hop bum, KABOOOM" ideaI hope I am wrong. :D Stay long from 47,50€/LTC but, I have feeling

descending triangle on ltc eur--correction incomingThis one triggers all the parameters required. tightening range, volume declining..


LTCEUR30 minute chart idea produced in 3 minutes. Just an idea, I won't enter trade.
If it will stay inside this ascending channel and break two resistances, it will go to 150.
On downside we have nice support at 104, if this fails, next stop is 87.

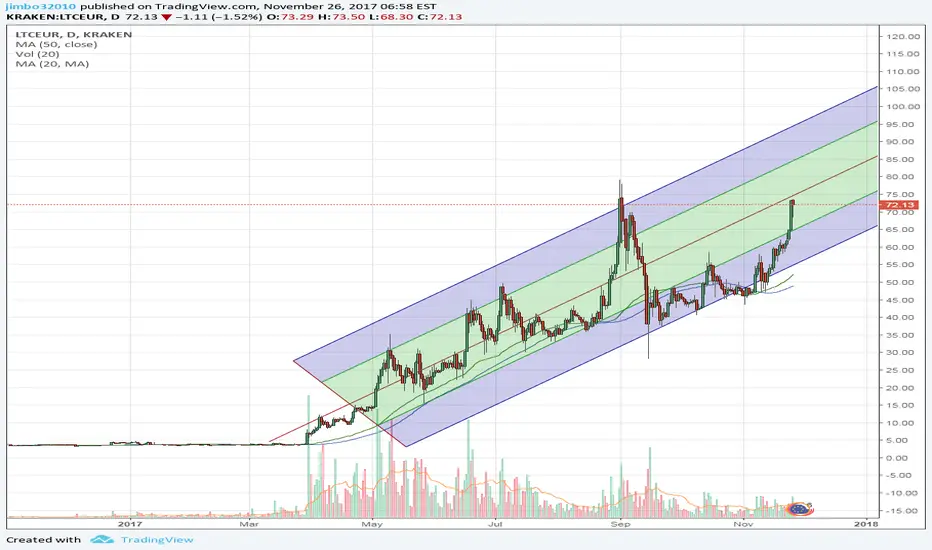
Litecoin CRASH SOON, Wait for Buy ZoneCHANNEL BOUND:
Litecoin has reached the top of it's range in this chart based on Euro
from Kraken. The USD chart looks the same.
We see this channel going back to May and so far it has proven a reliable predictor of price movement.
We should play the range of this channel until a breakout to the upside or downside.
The odds are in your favor to take profits now at this 130 level in the EUR and 165/170 in the USD pari.
Then we wait for a pullback to the buy zone at the bottom channel line around 100.
THE TRADE:
Take profits now in Litecoin around 133 in the EUR
Buy on a pullback to the buy zone around 100 and take profits around 200 EUR
OVERALL LONG TERM TRADE:
Long term, this price trend is very bullish and you can buy and HODL Litecoin as long as this channel is intact.
Good trading!


LTCEUR to Correct Near 90D LR & 60D SMA, Then Continue BullishLTCEUR to Correct Near 90D LR & 60D SMA, Then Continue Bullish Trend. In line with 90D LR. Big correction incoming. Hold on.

LTC showing strong correlation with BTCLitecoin has just peaked like Bitcoin did just about 48 hours before. This makes sense as LTC it is often touted as the "lightweight" version of BTC.
My guess is that after BTC 's and IOTA 's amazing rise, many newcomers are opening to alt trading and are betting for Litecoin, especially in the Coinbase app (which, incidentally, is no. 1 in the iOS app store). It is very probable that the chart will continue to show perhaps a second peak and then correct slightly and plateau.


LTC/EUR bullish flag pattern formationLooking at the 2h chart, LTC/EUR has recovered from the cryptocurrency flash crash of some days ago (after a clearly visible reverse head-and-shoulders) and is now consolidating at around 86€, exhibiting a bullish continuation flag pattern.
If price was to break past the resistance at 87.8€, the price could test the 100€ level (probably going higher, but since 100 is a round number, it becomes a psychologically important level to break).
The RSI is showing higher lows while the price made higher lows, which seems to indicate that the momentum is not fading away.
Also, the CCI hit 180 after the crash, which could indicate that the move is sufficiently strong. The CCI has then retraced inside the -100/+100 bands, but is still positive and looking like it will go up again (this will happen if there is actually a bullish flag pattern).
On the other hand, if price was to break the support at 86€ (it would have to close lower, like 85€), the price could fall till the nearest support at around 80€.
Any comment is appreciated!

The price would go back probably to the resistance 51.59 .The price would go back to the resistance 51.59 after that it could be a good opportunity for buying until the resistance 96.55.

The price returns to the resistance 59.56 Euro The price returns to the resistance 59.56 after that it could be a good opportunity for buying until the resistance 94.10 .


LTCEURAfter a steady upwards trend until almost 74 euro, LTC seems to have a healthy pullback now.
Expected pullback until around 63 euro, this would also be the moment to buy.
Buy target; 63.80 euro
Expected target; 90 euro.
Goodluck


Litecoin - Bearish BATLitecoin has made a fast movement up to previous high and just completed a Bearish BAT pattern. We allready have RSI Divergence so now we´re just looking to get RSI confirmation.
The aggressive trader is allready bearish but I´m w8ing for RSI to break below extreme.
Also, with the RSI Divergence, just now, we have a double top confirmed.