Litecoin rising wedgeI'm holding LTC, so I'm happy to see the current rise, but I'm a bit worried about the current pattern forming. The rising trading range seems to be narrowing, forming a rising wedge. This can be a sign of buyers exhausting themselves against stronger sellers. Eventually such rising wedge will fail and prices will drop. Best case scenario's for those going long is that this would be a brief correction before further growth, provided it stays over 58 euros.
LTCEUR trade ideas


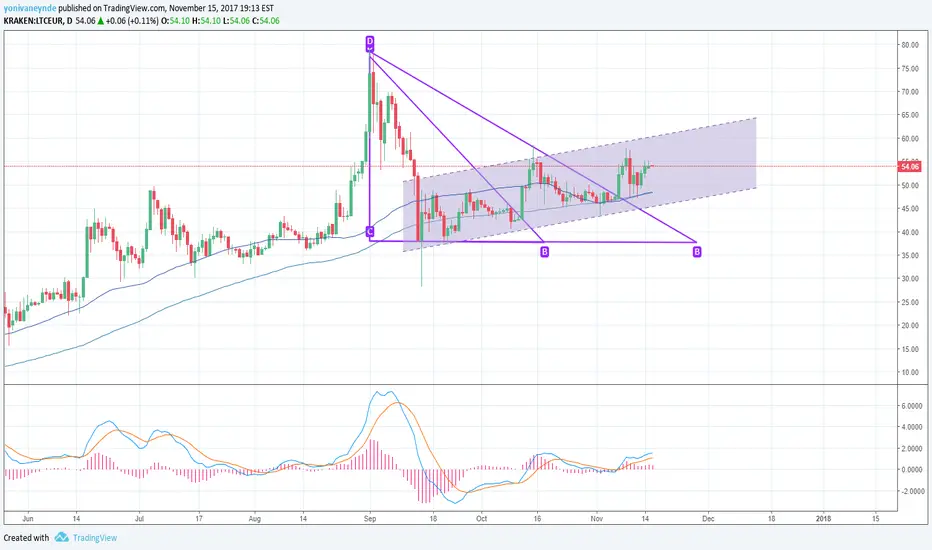
Litecoin perfect place to position yourself, BuysignalsSeveral triangle breakouts in the past and a ascending trading channel are in place to several months now on Litecoin.
We are still located at the lower levels of these indicators and therefor a perfect spot to take positions. Break outside the bullish trading channe will acellerate the upward momentum rapidly. Based on historical date litecoin should climb a little steeper, therefore a break of the upper ascending trendline and trending upwards above it is not unimaginable.
Litecoin is said to be the most undervalued cryptocoin, a hidden damond waiting to be dicovered so you re not yet too late to get in
Recommended action:
Buy at the lower trendline of the trading channel. Or more conservative wait for a break outside the upper trendline of the trading channel.
Trading at your own risk, make sure you understand the risks involved with trading high volatility markets.
Trade safe,
LTCEUR 30min - coinbase - thoughts on recent price boostAfter yesterday's increase in price, LTCEUR has dropped to a 1.6 fibb level, below the initial support level. It then tested that resistance and failed to break it. Does this mean LTC is about to drop even lower or will it continue the path we saw yesterday? Let me know your thoughts. Any questions/comments are much appreciated!
Cheers!

LTC trendLTC can drop to 46.00, but I expect a bounce afterwards.
posting this idea to remind myself and to record the trend progress

MACD strategieWhen the blue line cross the orange from the bottom chances increase for a bull movement .
When the orange line cross the blue from the bottom chances increase for a bear movement.

LTCEUR - same old storySupport 2 from previous analysis was strong enough and we are heading up again. And again the crucial level to break is ~50. If LTC will manage to close nicely over 50, we will aim for 53 and 58. Especially, if so long awaiting BTC correction will pop up and also other cool coins will get some attention.
Previous analysis:


LTCEUR - funny beastI entered in previous trade too soon at 50.1 (well, not too soon, but things turned south) so I'll wait for some rise before trading this pair again. Here are some options.
We have some support in triangle between shorter trendline and 61% Fib level of the last rise. If this support will get broken, we have another one between longer support line and 78% Fib level. Last resort on downside is support around 40.5 EUR.
But if we manage to bounce from current level and break that 51-ish resistance, we could aim for 54 and 58 price levels.
If resistance won't get broken, we will probably trade inside ascending triangle between shorter trendline and resistance. In this case we'll have more information about future price levels - in the future ;)


LTCEUR - to wait or not to wait?Buying at ~46 would be great, if we ever get there ... If not, enter the trade above 50 and aim for 58, 68 and 74.
So, let's put orders for both options (Limit at 46.46 and Stop limit above 50) and see what the future will bring us!

Bullish pennant and some noob predictionInitial large volume on pole formation and weakening volume within the pennant itself

LTCEUR - where will you go?Fib extension on 12.10. and 13.10 showed us possible rally price levels. We reached 1.618 level, which is very good!
Of course bull raised up and now we are fighting our path up between 0.236 and 0.382 Fib retracement of last rally. It's worth to mention that this 0.236 level is also 50% Fib retracement level of last decline from 79.60 to 27.45 in first half of September.
We have three options and I can't decide which one is more probable, so we'll have to watch this market:
a) break above 55.5 with good volume and nice close above it would lead us towards our targets (T1, T2 and T3), on each target some part of trade should be cashed out. Stop loss for this one should be below 51.
b) we'll be trading in channel between 55.5 and 51.5. Not good for trading IMO.
c) pullback through 0.382 level (Vintage support 2) would lead us to Support 1 and maybe lower. We'd have to watch the market closely.


Bye Bye LTC, see you after the weekend;)I Expect LTC to drop soon-.... Its taking to long to break trough right now. So perhaps a re-focus could be good.
I've got good expectations for BTC (short) and XRP (mid-long).
What do you guys think is a good short besides BTC?

LTC Short - ObviousLTC is about to break out, i'm expecting it to climb up to aprox € 55 / €60. even better for long term, aprox €75 before december. Its all about the repeating pattern and the rise of BTC.

LTC/EUR Long Term Trade (EURO)MACD is showing Positive divergence. Higher lows on indicator and lower lows on chart are revealing that there will be trend change soon.
At these levels it's great opportunity to open long term trades.
Buy In: around 43.5 level
Long Term Profit: 60-62 levels and level 74
Captain appreciates constructive feedback & comments :3 Yarr!

LTC/EURThree floors for LTC show when to go long when the floor has been stablished. If floor is broken I will not buy. Each candle is 1h worth of time.
