Litecoin Continues Its Bullish Cycle As ExpectedLitecoin Continues Its Bullish Cycle As Expected, which can send the price even higher from technical point of view and by Elliott wave theory.
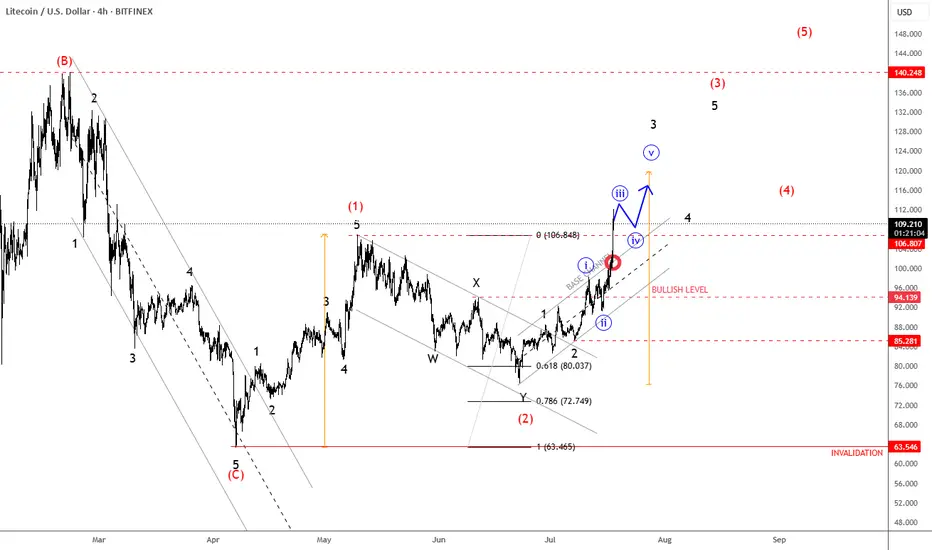
We talked about Litecoin back on May 30, when we spotted a bullish setup formation with waves (1) and (2) that can extend the rally within wave (3) of a five-wave bullish impulse.
As you can see today on July 18, Litecoin with ticker LTCUSD is now breaking strongly back above May highs after we noticed a complex W-X-Y correction in wave (2). Now that ALTcoin dominance is stepping strongly in, we may easily see more gains within a projected five-wave bullish cycle during the ALTseason, just be aware of short-term pullbacks.
LTCUSD.P trade ideas
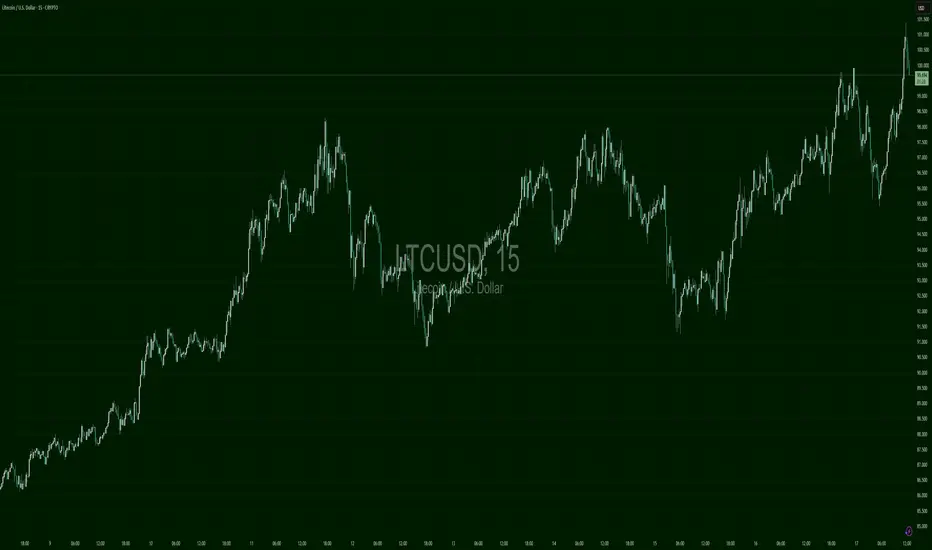
LTCUSD – Winding for BreakoutLTC rallied from $89 to just over $101.50 in a volatile swing. The structure shows bullish compression with higher lows forming beneath $101. A push through $101.80–$102 would likely initiate a fast breakout toward $104+. Bearish only if price breaks $98.80.
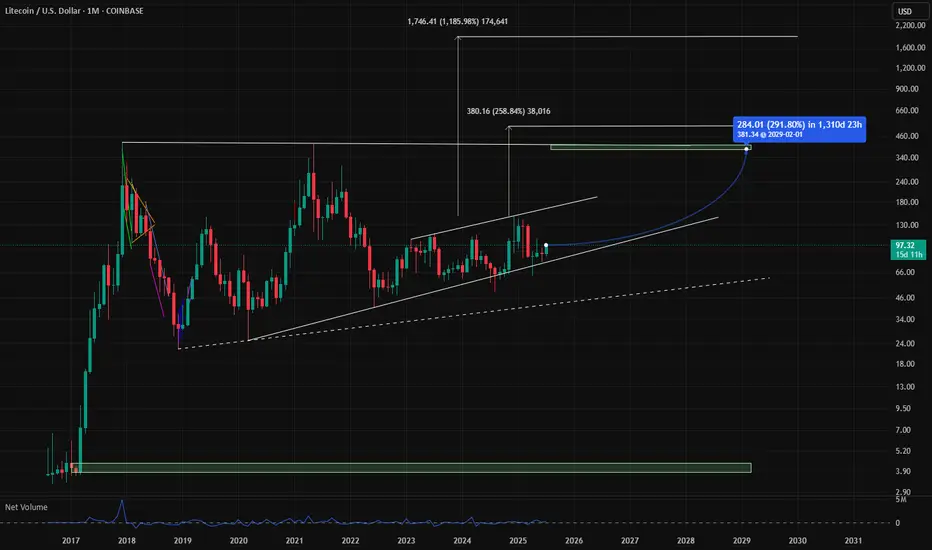
LTC Targets 400$ + 1900$ Litcoin LTC Targets for the next run are atm +290% is a realistic szenario. The addvanced targets at 1900$ are very impressiv but remember there are only 21 Mio. Coins too, like BTC because it is the fork and think about an alternative payment methode like btc, would be a reason for 1900$ pro LTC. So in Crypto is nothing unreal if you could imagine, but first of all approx. 400$ are a good direction. GM
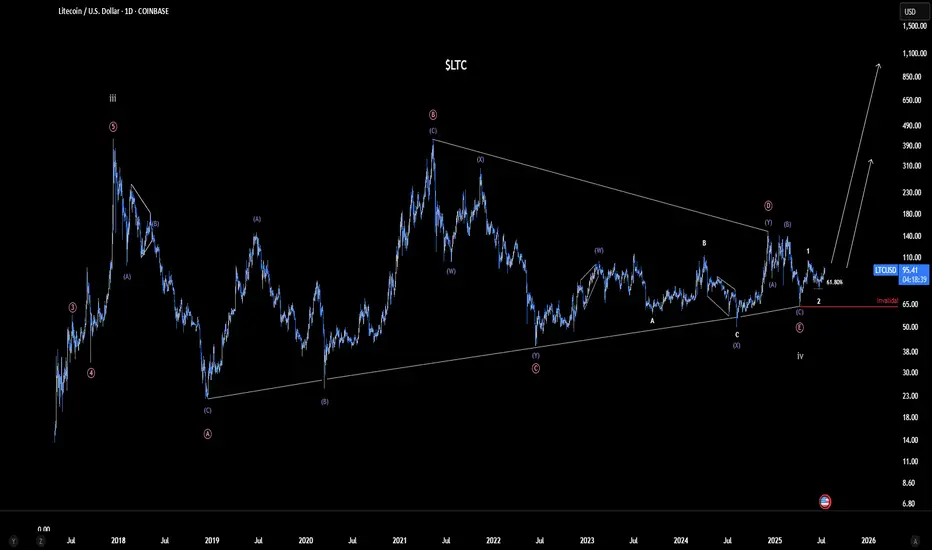
Litecoin (LTC) - $1000 Target Hype or Reality? | Ew analysisLitecoin may be on the verge of a breakout following nearly four years of accumulation. From a technical standpoint, this could lead to a powerful rally toward targets in the $600–$1000 range. However, the timing of this Wave 4 consolidation don’t align particularly well with a typical, healthy correction. A break below the red line would invalidate the current count and shift focus to my secondary outlook.
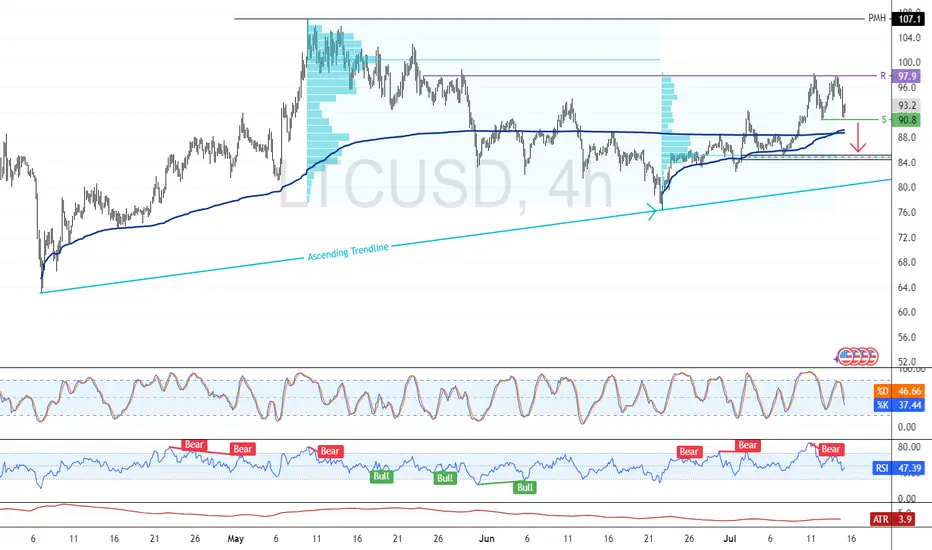
Litecoin: Volume-Heavy Resistance Caps RecoveryFenzoFx—Litecoin fell 2.50% today, forming a double bottom at $90.80. If bears stabilize the price below this level, the decline could extend toward $85.20 support.
Resistance at $97.90 aligns with a high volume zone, reinforcing bearish pressure and making a breakout challenging.
LTCUSD💥 LET’S TALK ABOUT LITECOIN (LTC) – THE SILVER OF CRYPTO IS WAKING UP ⚡
For years, Litecoin was seen as the silver to Bitcoin’s gold – a trusted, fast, decentralized payment coin that’s been around since the early days. But lately… it’s been flying under the radar. Almost no one talks about it. 👀
And that’s exactly why smart investors are watching it closely right now. 📈
🔍 From a technical perspective, if you zoom out and compare the macro structure of LTC to XRP, you’ll notice some striking similarities:
✅ A massive bullish harmonic pattern forming
✅ Multi-year accumulation zone – strong hands have been loading
✅ Volatility compression + breakout structure
✅ Ready for a beast-mode expansion phase 🚀
We’re not throwing wild guesses here – the technical case for a major move is solid. Seeing LTC revisit the $900 zone? Not just possible — plausible, especially as market sentiment shifts back toward legacy altcoins with proven track records.
🧠 Don’t sleep on this just because it’s not the shiny new alt. Often, the biggest moves come from forgotten giants.
💡 If you're not comfortable buying crypto directly, many brokers offer ETPs (Exchange Traded Products) linked to Litecoin. Just search for Litecoin ETP or LTC tracker on your preferred platform.
TL;DR: Litecoin is coiled. Fundamentals are strong. Technicals are explosive. The silver is about to shine again. 🌕⚒️
#Litecoin #LTC #CryptoAlert #CryptoTrading #Accumulation #Altseason #SilverOfCrypto #BreakoutIncoming #ETP #TechnicalAnalysis

The come back of digital Silver ?Litecoin still stuck inside one of the largest and most boring consolidation pattern in the cryptoverse.
Now BTC.D is about to flip, there is still a chance LTC could find a way out and get a super powerful breakout !
Blue line is LTC halving.
Then we always had the typical post halving dump before longer consolidation.
Fun fact is we can measure around 850 days from halving to peak of bull run.
That would give us a peak around November 2025.
There is so much room to the upside !!!!
Final target 2000 to 3000$
LFG !

LTCUSD – From Messy to MeasuredLTC had a sharp run-up into $98, then a deep flush to $91. After a choppy double-bottom, bulls regained structure with a tight consolidation between $95.80–$97.50. A breakout above $97.80 could retest $99. Caution if $95.50 breaks — lower lows would resume.

Is This the Perfect Moment to Rob the LTC/USD Vault?🏴☠️ LTC/USD Heist Mode: The Moving Average Break-In Plan 💰📈
🌟Hi! Hola! Ola! Bonjour! Hallo! Marhaba!🌟
Calling all Market Bandits, Crypto Hustlers & Chart Raiders! 🤑💰🚀
🚨Mission Briefing
We’re eyeing a bullish breakout hit job on the LTC/USD chart — all based on the elite 🔥Thief Trading Style🔥 with a touch of candle science, moving average vault-cracking, and some solid day/swing setups. This ain’t your grandma’s trade plan — this is high-level lootin’ with precision.
🕵️♂️ 🎯 ENTRY PLAN — Unlock the Vault at $86.00
Wait for the MA breakout + candle close above that sneaky Moving Average line.
➡️ Execute Buy Stop orders above MA
➡️ OR place Buy Limit during a pullback to swing low/high zones in 15m–30m timeframe.
📌 Pro tip: Set an alert – catch the breakout live, don’t chase it later.
🛑 STOP LOSS — Your Getaway Route
Place your Thief SL near the recent swing low (82.00 using 3H chart).
🎤“If you’re entering like a pro, stop loss goes where it should – not where fear lives. But hey, it's your ride or die. Choose wisely.” 🔥
💡Adjust SL based on lot size, risk %, & how deep your robbery goes.
🏴☠️ TARGET ZONE — Exit the Scene at $92.00
Get your bags packed, profits stacked, and be ready to escape before the market catches on.
💸 Grab the loot and bounce before the reversal gangs arrive!
📈 Why the Heist?
The LTC/USD crypto market is showing bullish momentum, backed by key analysis angles:
🔍 Fundamentals
📊 COT Report
💥 On-Chain Metrics
🧠 Sentimental Heat
🌍 Intermarket Structure
👉 Check your intel. React. Don’t sleep. 🔗🔗
⚠️ News Alert & Risk Tip
🗞️ Stay clear of trades during volatile news releases
🔐 Use trailing stops to lock in gains
🚫 Protect your positions – don't let profits slip through cracks.
📌Disclaimer:
This ain’t financial advice — it’s just a shared plan for market raiders. Trade at your own risk, and don’t forget to bring your own map. Market shifts faster than a getaway car — so adapt & react smartly. 🧠💡
💖 BOOST the Plan 💥
Hit that Boost Button if you're vibin’ with the robbery crew. It powers up the strategy and supports the movement. Together, we trade to take — The Thief Trading Way. 💸💪🎉
🚀 Catch you on the next breakout. Stay sneaky, stay sharp. 🐱👤🤑

When YouTubers Say 'No'… We Say 'LTC Go!'I’m not here to drop some fancy technical analysis today.
I’m here to tell you… this might just be it.
A big, popular YouTube channel just announced they’re not too bullish on Litecoin this cycle.
And guess what? That might actually be our ultimate buy signal.
The chart’s looking bullish now — the trap has been set, and left behind us. 😎
They FUD, We Flood (Our Bags)
Why Litecoin? Beyond its unshakable fundamentals, if you genuinely understand and believe in crypto and digital freedom, Litecoin is the purest expression of that vision
That's it, that's the idea" - Good night !

LTC starting wave 3This wave will bring us to the break out level, charts looking fantastic and overall bullish. Btc.d still didn't start to melt and the LTC pair is looking to recover the 0,001 and higher for the run. The LTC run from 4 to 420 lasted around 9 months ,the runs from 40 to 420 lasted around 6 months, if me start running now we have get 6 months till the bull ends... Lets keep our eyes open.

Litecoin to $1100 (12X) In This Coming AltseasonBased on tried and true fractals, multi-fib confluences, and historical price action, Litecoin is poised to hit prices between $900-1500 this cycle. The multi-fib confluences are pointing to $1100-1200 range as the most likely target. This is expected over the next 6-12 months if things continue to play out how I am expecting. As of today SEC approval of a LTC ETF is imminent but yet to be actualized.

LTC : Keep an eyeHello, good ? Me no.
LTC is a crypto dino ? A old type of crypto ?
Ok but now look the chart, you know.. some perfect project have never gain.
In monthly we have a beautiful range since 2017. Top is 350 and bottom is 40 dollars.
We have an important intermediate level at 110 dollars.
But, the blue resistance is where you have to enter is break. Necessary to look in daily, because the breakout can be savage
Keep an eye on RSI monthly... Imagine if RSI resistance is break. Moon shot.
Short term target : 350
Long terme : 2000

Litecoin Faces Resistance at $92.32 Amid Overbought SignalsFenzoFx—Litecoin is overbought as price nears resistance at $92.32. Stochastic reads 91.0, suggesting an overbought market. If LTC stays below $92.32, a bearish wave may emerge, targeting $88.47 support.
However, a close above $92.32 could trigger a bullish move toward the $100.0 mark, reinforcing the upward trend.

Update on $LTC 1MUpdate on CRYPTOCAP:LTC 1M
I think it's time for Litecoin to give us that alpha rally we all have been waiting for years now.
Pattern signs bullish, ETFs are flooding in, Altseason is at the corner.
Make sure you bag this cuz I'm looking at a quick 2k to 3k target.
#LTC #LTCUSD

Litecoin Eyes Breakout Above $88.5 ResistanceFenzoFx—Litecoin climbed from $85.7 and is currently testing resistance at $88.5. The market remains bullish above $84.5, a support backed by the Fair Value Gap.
If bulls manage a close above $88.5, momentum may build toward last week's high at $92.3. However, a drop and stabilization below $84.5 would shift focus to the weekly low at $82.4.

Trading balanceTrading balance The price of the asset has rebounded from the balance zone. With the prospect of growth into the resistance zone.

Litecoin Rebounds from FVG with $902.3 in SightFenzoFx—Litecoin is trading just below the $88.6 resistance after bouncing from the bullish fair value gap near $85.5.
If the $88.60 resistance is breached, LTC could aim for the previous week's high at $902.3. Please note that the bullish view remains valid above $82.4.

Long trade
Trade Details
Pair: LTCUSD (Litecoin / US Dollar)
Trade Type: Long (Buyside)
Session: NY AM, Monday, June 23rd, 2025
Time: 11:00 AM
Entry & Exit
Entry: $81.74
Take Profit (TP): $92.84 (+13.58%)
Stop Loss (SL): $79.48 (-2.76%)
Risk-Reward Ratio (RR): 4.91R
Trade Setup & Rationale
Structure: Price was consolidating above its moving averages; bullish momentum was building after the pullback. Confirmation: Entry followed the break above both the EMA (86.90) and WMA (86.02), with strong upward volume.
Target Zones: Take profit set at the top of prior consolidation and gap-fill zone.
Stop: Below the key structural low.

LITECOIN (LTC) - On The Verge Of Exploding - ETF Catalyst?Litecoin: A Decentralized Network with a Differentiated Risk Profile
Litecoin (LTC), launched in 2011 by former Google engineer Charlie Lee, is one of the oldest and most active Layer-1 blockchain networks in the cryptocurrency space. Often referred to as the “digital silver” to Bitcoin’s “digital gold,” Litecoin was designed to offer faster transactions, lower fees, and broader accessibility while maintaining a similar monetary policy and codebase.
This post aims to provide an overview of Litecoin’s technical structure, usage, risk profile, and current developments—without speculative bias—so readers can form their own assessments.
1. Transparent Origins and Founder Dynamics
One key difference between Litecoin and Bitcoin lies in the identity of their respective creators. Bitcoin was developed by Satoshi Nakamoto, a pseudonymous and still-unknown individual or group, who is estimated to hold 750,000 to 1.1 million BTC—a significant portion of the total supply that has never moved. The dormant status of these holdings has occasionally raised concerns about future market impact if they were ever activated.
In contrast, Litecoin was founded by Charlie Lee, a known and public figure who was active in the community before, during, and after the launch. In 2017, Lee announced he had sold or donated nearly all his LTC holdings to avoid any potential conflict of interest. Today, no founder or insider is known to hold a disproportionate share of the Litecoin supply. This level of transparency and decentralization has been interpreted by some as a factor that lowers long-term governance and concentration risk.
2. Structural Simplicity and Leverage Exposure
Another distinction between Litecoin and Bitcoin lies in market structure and exposure to leverage.
Bitcoin is widely used as collateral in crypto lending markets and institutional derivatives, including perpetual futures and structured products. This has introduced significant systemic risk during periods of market stress, as high leverage has historically led to cascading liquidations across centralized and decentralized platforms.
Litecoin, in contrast, has relatively limited exposure to leveraged products and collateralized lending. It is not commonly used as collateral in CeFi or DeFi protocols, and institutional futures markets for LTC are smaller and less active. As a result:
Litecoin is less likely to trigger or be affected by mass liquidations
It has reduced systemic risk due to lower market entanglement
Its price tends to reflect more organic supply/demand dynamics
It is less involved in cross-collateralized or rehypothecated loan systems
This simpler structure may appeal to risk-aware investors looking for cleaner exposure without the reflexivity effects common in heavily leveraged markets.
3. Scarcity and Monetary Policy
Litecoin shares a similar deflationary model with Bitcoin, with a hard cap of 84 million LTC and scheduled halving events every four years. The most recent halving occurred in August 2023, reducing the block reward from 12.5 to 6.25 LTC per block.
With over 75 million LTC already mined, fewer than 9 million remain in future issuance. The protocol’s monetary policy is deterministic and cannot be altered unilaterally, which may appeal to those who prioritize predictable supply and inflation resistance.
While Litecoin’s cap is four times higher than Bitcoin’s, the relative issuance schedule and halving dynamics mirror Bitcoin’s design. Some investors view this as a hedge against fiat currency debasement, although the asset's volatility and adoption context should be taken into account.
4. Network Fundamentals and Real-World Use
Litecoin has maintained near 100% uptime since inception, and its transaction throughput and fee structure are generally favorable compared to many competing networks.
In 2024, Litecoin became the most used crypto for payments via BitPay, surpassing Bitcoin in transaction volume, driven by its fast 2.5-minute block times and low transaction fees. It is supported by major platforms including PayPal, and accepted by thousands of online and retail merchants.
From a security perspective, Litecoin’s hashrate reached all-time highs in 2025, partly due to merge-mining with Dogecoin, which has helped strengthen its proof-of-work infrastructure. Network upgrades like MWEB (MimbleWimble Extension Blocks) have added optional privacy layers to Litecoin’s UTXO model, while Lightning Network integration supports instant payments.
These developments suggest that Litecoin continues to evolve, with emphasis on efficiency, user privacy, and practical usability.
5. Institutional Presence and ETF Outlook
Litecoin has seen modest but growing institutional involvement. Products such as the Grayscale Litecoin Trust (LTCN) have existed for several years, and Coinbase introduced Litecoin futures trading in 2024. Fidelity also offers LTC trading and custody to institutional clients.
More notably, a Spot Litecoin ETF application is currently under review by the U.S. Securities and Exchange Commission (SEC), with analysts from Bloomberg estimating a 95% probability of approval before the end of 2025. If approved, this would make Litecoin one of the first proof-of-work assets outside of Bitcoin to gain direct exposure through a regulated ETF vehicle.
Should that happen, it may increase access, liquidity, and legitimacy among traditional investors. However, as always, regulatory decisions remain uncertain and subject to broader political and market conditions.
6. Technical Structure and Long-Term Price Action
From a macro-technical perspective, Litecoin has historically followed a pattern of higher lows and higher highs across each market cycle. This structure remains intact as of 2025, with a strong support at 81 USD on a 6 months timeframe.
Summary
Litecoin presents a combination of characteristics that differentiate it from other crypto assets, including:
✅ A public, transparent founder and no major insider dominance
✅ Limited exposure to leveraged lending, reducing systemic risk
✅ Deterministic monetary policy with a fixed supply and halving schedule
✅ Real-world usage in payments and retail adoption
✅ Strong network security and development activity
✅ Potential ETF approval that may broaden accessibility
These features do not necessarily imply outperformance, but they form the basis for an asset with a relatively clean structure, historical resilience, and a distinct position in the crypto ecosystem.
🔎 Disclaimer:
The information presented here is for educational and informational purposes only and should not be interpreted as financial advice.
Always conduct your own research, assess your individual risk profile, and make investment decisions based on your own analysis and objectives.

Bullish Momentum Possible While LTC Holds Above $86.93Litecoin pulled back from $92.32, dipping to a key support at $88.52, backed by Anchored VWAP. Stochastic shows oversold conditions, signaling a potential rebound.
If $88.52 holds, a bullish wave toward $92.32 could follow. The outlook stays positive above $86.93;


LTCUSD - 3M CHARTYou tell me where the target of this 3M chart is. The higher the timeframe, the higher the probability to get the price targets…. Fundamentals are lined up. LFG!
