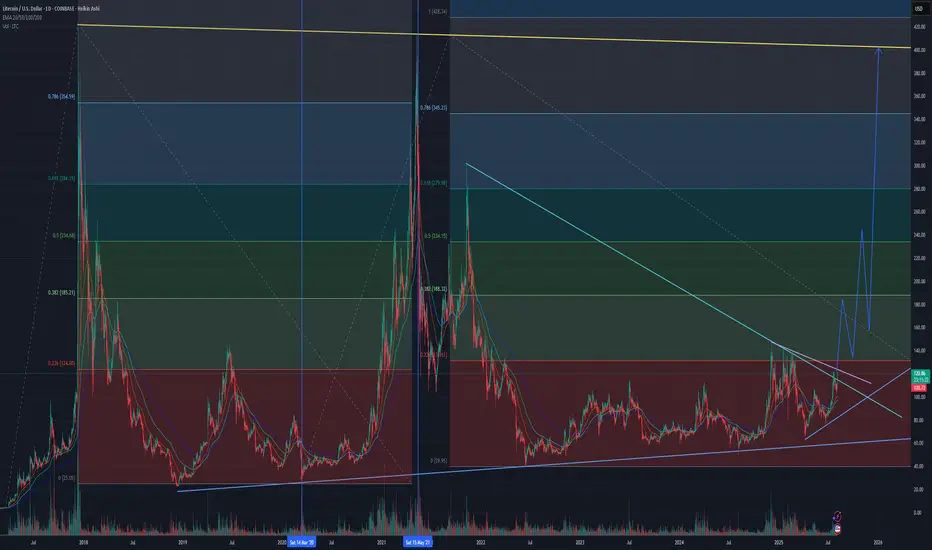
Why Litecoin is my #1 pick right nowObserving the price action between the two vertical blue lines (the '20 to '21 bull cycle), and comparing to the trend based fib extension levels on the left, we have a blueprint for the fib levels that LTCUSD responds to. At the .236 fib, a 24% pullback. At the .382 a 36% pullback. At the .5 a 38% pullback. Then the market got super heated and it blew past the .618 and had another 38% pullback before the final push up to $413, followed by a 75% "correction".
I'm using those fib levels for my sell/buyback zones in the current bull cycle:
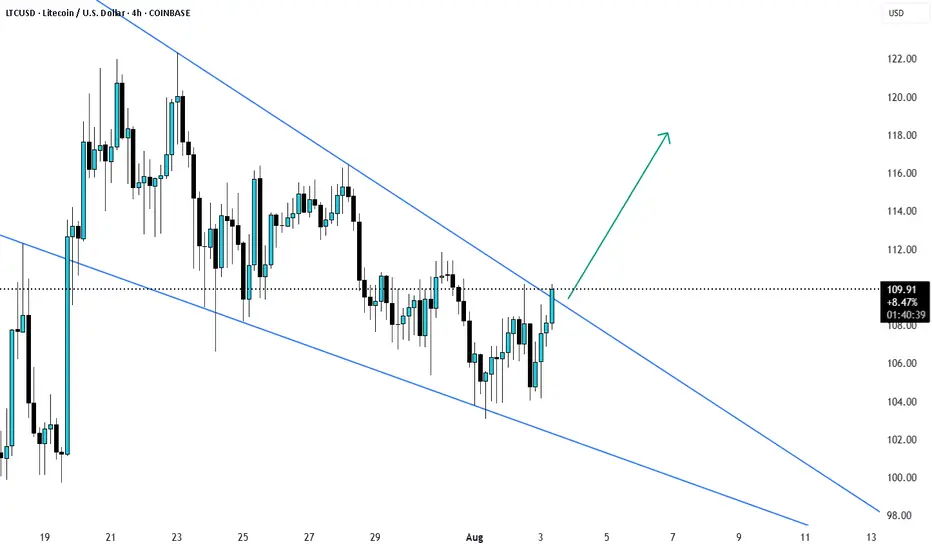
- The first one is at $131, but I think LTC may blow past this one since it's so close to where LTC is breaking out of the trendline and the crypto market just had a retrace.
- The second level is at $188.
- Third level at $234.
- The final level I'm aiming for is the golden trend line at around $400.
- Based on breaking out of the long descending wedge on the LTC:BTC chart, it's possible for LTCUSD to have a huge blow-off top and hit upwards of $600.
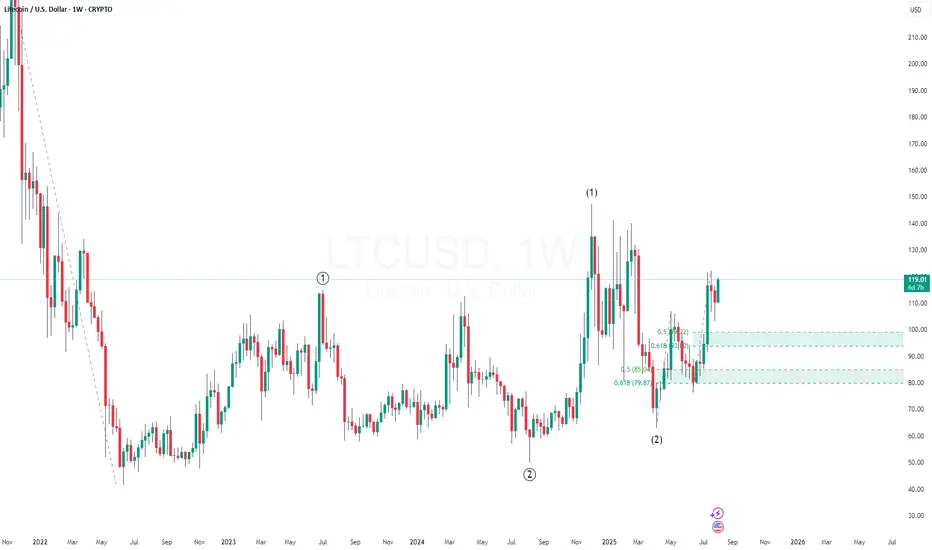
Looking at the LTC:BTC pair, (see my last post), Litecoin has a huge potential in the current bull cycle. In the '20-'21 cycle it didnt breakout against bitcoin until the end of the bull run and that breakout wasn't major. LTC:BTC is currently breaking out of a long-term trendline with significant volume.
We'll see. But one thing is for sure, LTC held up well against BTC during the recent drop from $119k to $112k, and now it's pumping steadily. Lookin' good.
What do you think?
LTCUSD trade ideas
LTCUSD Breakout? wait for candle to closeLTCUSD trading in a down trend has now broken the resistance and wait till the candle is closed and possibly retest and then enter the trade. target can be 118-120

LTC Could Be Gearing Up for a Massive Wave 3 post 1-2, 1-2 Litecoin (LTC) appears to have completed a 1-2, 1-2 wave pattern, a classic bullish setup in Elliott Wave theory that often precedes an explosive move.
This nested formation signals strong internal momentum, where both the higher and lower degree structures are aligned for upside. If the count holds, LTC is now positioned to launch into Wave 3 of the larger Wave 3 — typically the most powerful and extended rally in the entire wave cycle.
Is Litecoin a free ride to $400?Taking a look at what I believe may be the most undervalued asset in the market as it has broken out of a trend line and is headed towards another test of a monthly level. This level has proven multiple times to be very rewarding. I think this may end up being one of the easiest trades in the market right now.

Litecoin is Lagging.Company held Litecoin is emerging, we're only getting started. Arriba.
P.S. ETF deadline on August 4th, 2025.
CRYPTOCAP:LTC $113.80

Litecoin H4 | Bullish bounce off 50% Fibonacci supportLTC/USD is falling towards the overlap support and could bounce to the take profit
Buy entry is at 101.85, which is an overlap support that lines up with the 50% Fibonacci retracement.
Stop loss is at 97.43, which is a pullback support that aligns with hte 61.8% Fibonacci retracement.
Take profit is at 110.38, an overlap resistance.
High Risk Investment Warning
Trading Forex/CFDs on margin carries a high level of risk and may not be suitable for all investors. Leverage can work against you.
Stratos Markets Limited (tradu.com ):
CFDs are complex instruments and come with a high risk of losing money rapidly due to leverage. 65% of retail investor accounts lose money when trading CFDs with this provider. You should consider whether you understand how CFDs work and whether you can afford to take the high risk of losing your money.
Stratos Europe Ltd (tradu.com ):
CFDs are complex instruments and come with a high risk of losing money rapidly due to leverage. 66% of retail investor accounts lose money when trading CFDs with this provider. You should consider whether you understand how CFDs work and whether you can afford to take the high risk of losing your money.
Stratos Global LLC (tradu.com ):
Losses can exceed deposits.
Please be advised that the information presented on TradingView is provided to Tradu (‘Company’, ‘we’) by a third-party provider (‘TFA Global Pte Ltd’). Please be reminded that you are solely responsible for the trading decisions on your account. There is a very high degree of risk involved in trading. Any information and/or content is intended entirely for research, educational and informational purposes only and does not constitute investment or consultation advice or investment strategy. The information is not tailored to the investment needs of any specific person and therefore does not involve a consideration of any of the investment objectives, financial situation or needs of any viewer that may receive it. Kindly also note that past performance is not a reliable indicator of future results. Actual results may differ materially from those anticipated in forward-looking or past performance statements. We assume no liability as to the accuracy or completeness of any of the information and/or content provided herein and the Company cannot be held responsible for any omission, mistake nor for any loss or damage including without limitation to any loss of profit which may arise from reliance on any information supplied by TFA Global Pte Ltd.
The speaker(s) is neither an employee, agent nor representative of Tradu and is therefore acting independently. The opinions given are their own, constitute general market commentary, and do not constitute the opinion or advice of Tradu or any form of personal or investment advice. Tradu neither endorses nor guarantees offerings of third-party speakers, nor is Tradu responsible for the content, veracity or opinions of third-party speakers, presenters or participants.

LTC Adoption CurveThere was adoptions like this: TV, color TV, refrigerator, phone, mobile phone, pc. Now it's time for crypto. It's 7% today, summer 2025.

Litecoin is about to begin a leg upLitecoin is about to begin its first expansion. Alt season seems to be well underway and mid caps like LTC are next on the docket for money flow.
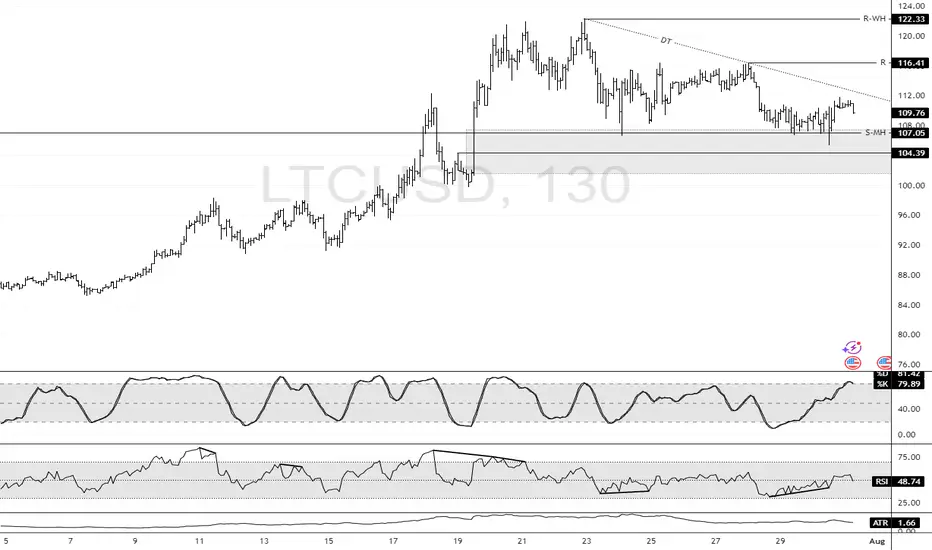
LTC: Bullish Structure Intact Above $104.3 SupportFenzoFx—Litecoin swept liquidity below $107.0 during today’s session and is currently trading near $110.0, supported by a descending trendline.
Technically, key support stands at $104.3. As long as this level holds, the bullish outlook is preserved. A break above the descending trendline could propel LTC toward the previous highs at $116.4 and potentially $122.3.
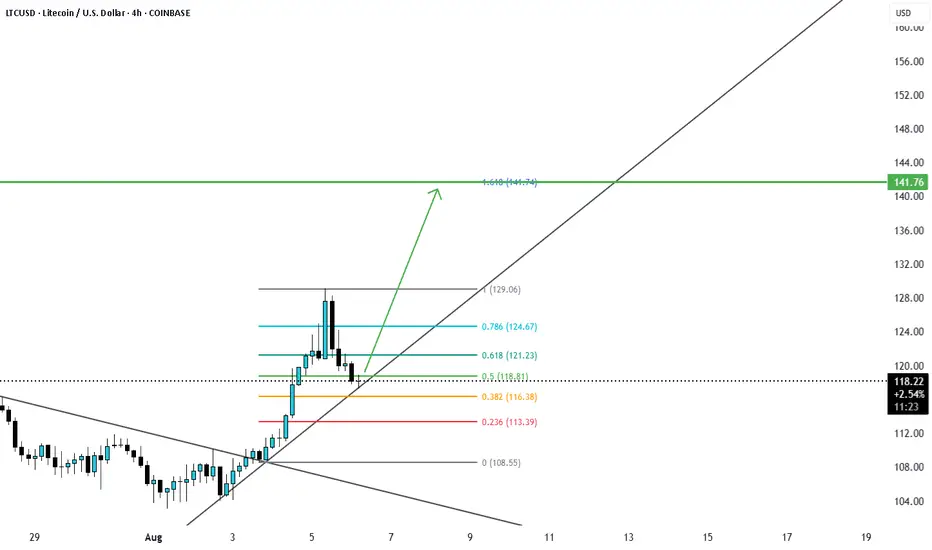
LTCUSD at Fib 0.5 and support price may resume up from hereLitecoin (LTC) recently broke out of a bullish wedge pattern, faced rejection around the $128–130 resistance zone, and has since retraced to the 0.5 Fibonacci level — presenting a potential entry point, with a stop-loss placed below the 0.382 Fib and a target around $140.
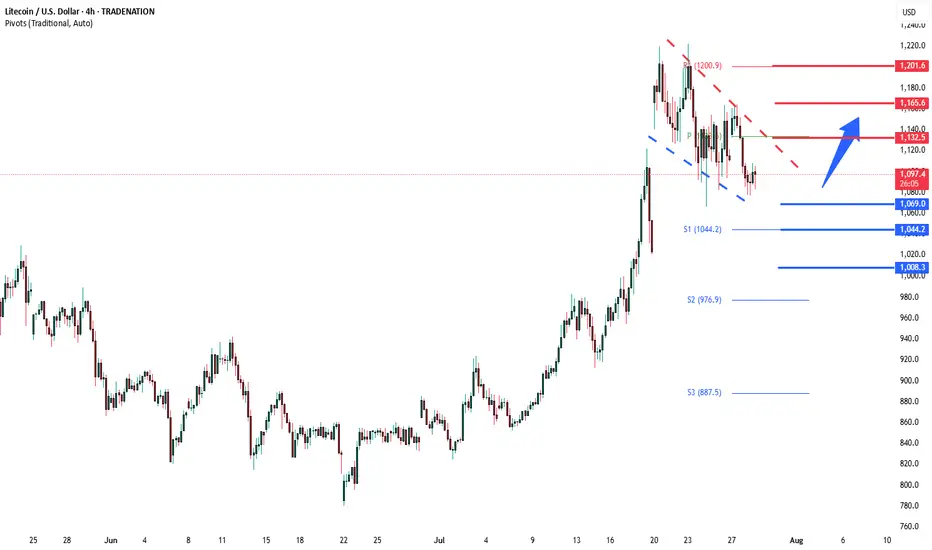
LTCUSD corrective pennant support at 1,070The LTCUSD remains in a bullish trend, with recent price action showing signs of a corrective pullback within the broader uptrend.
Support Zone: 1,070 – a key level from previous consolidation. Price is currently testing or approaching this level.
A bullish rebound from 1,070 would confirm ongoing upside momentum, with potential targets at:
1.132 – initial resistance
1,165 – psychological and structural level
1,200 – extended resistance on the longer-term chart
Bearish Scenario:
A confirmed break and daily close below 1,070 would weaken the bullish outlook and suggest deeper downside risk toward:
1,044 – minor support
1,008 – stronger support and potential demand zone
Outlook:
Bullish bias remains intact while the Gold holds above 1,070. A sustained break below this level could shift momentum to the downside in the short term.
This communication is for informational purposes only and should not be viewed as any form of recommendation as to a particular course of action or as investment advice. It is not intended as an offer or solicitation for the purchase or sale of any financial instrument or as an official confirmation of any transaction. Opinions, estimates and assumptions expressed herein are made as of the date of this communication and are subject to change without notice. This communication has been prepared based upon information, including market prices, data and other information, believed to be reliable; however, Trade Nation does not warrant its completeness or accuracy. All market prices and market data contained in or attached to this communication are indicative and subject to change without notice.
LTC Litecoin USD Textbook Cup & HandleLitecoin should finish its correction over the weekend and as we get into August the momentum will shift back to the upside. This is a washout of over-leveraged positionsbefore the next massive leg up. I still see a correction down to about 100 dollars. Could be a wick lower but not too confident. There is quite a bit of strength in Litecoin, and for good damn reason.
Not financial advice just my opinion. Thank you

LTCUSD H4 | Bearish reversal off pullback resistanceLitecoin (LTC/USD) is rising towards the sell entry that lines up with the 23.6% Fibonacci retracement and could drop lower.
Sell entry is at 110.45, which is a pullback resistance that aligns with the 23.6% Fibonacci retracement.
Stop loss is at 120.08, which is a swing high resistance.
Take profit is at 102.00, which is an overlap support that aligns with the 50% Fibonacci retracement.
High Risk Investment Warning
Trading Forex/CFDs on margin carries a high level of risk and may not be suitable for all investors. Leverage can work against you.
Stratos Markets Limited (tradu.com ):
CFDs are complex instruments and come with a high risk of losing money rapidly due to leverage. 65% of retail investor accounts lose money when trading CFDs with this provider. You should consider whether you understand how CFDs work and whether you can afford to take the high risk of losing your money.
Stratos Europe Ltd (tradu.com ):
CFDs are complex instruments and come with a high risk of losing money rapidly due to leverage. 66% of retail investor accounts lose money when trading CFDs with this provider. You should consider whether you understand how CFDs work and whether you can afford to take the high risk of losing your money.
Stratos Global LLC (tradu.com ):
Losses can exceed deposits.
Please be advised that the information presented on TradingView is provided to Tradu (‘Company’, ‘we’) by a third-party provider (‘TFA Global Pte Ltd’). Please be reminded that you are solely responsible for the trading decisions on your account. There is a very high degree of risk involved in trading. Any information and/or content is intended entirely for research, educational and informational purposes only and does not constitute investment or consultation advice or investment strategy. The information is not tailored to the investment needs of any specific person and therefore does not involve a consideration of any of the investment objectives, financial situation or needs of any viewer that may receive it. Kindly also note that past performance is not a reliable indicator of future results. Actual results may differ materially from those anticipated in forward-looking or past performance statements. We assume no liability as to the accuracy or completeness of any of the information and/or content provided herein and the Company cannot be held responsible for any omission, mistake nor for any loss or damage including without limitation to any loss of profit which may arise from reliance on any information supplied by TFA Global Pte Ltd.
The speaker(s) is neither an employee, agent nor representative of Tradu and is therefore acting independently. The opinions given are their own, constitute general market commentary, and do not constitute the opinion or advice of Tradu or any form of personal or investment advice. Tradu neither endorses nor guarantees offerings of third-party speakers, nor is Tradu responsible for the content, veracity or opinions of third-party speakers, presenters or participants.

Litecoin: VWAP and Oversold Signal Potential BounceFenzoFx—Litecoin formed a double top at $116.4, causing a price dip. Currently, LTC trades near $110.1 after forming a double bottom. The Stochastic Oscillator is in oversold territory, suggesting a potential bounce, supported by VWAP from July 15.
Technically, if LTC holds above $110.1 and key support at $104.0, the uptrend could resume. In this scenario, the bullish targets would be $116.4 and $122.3.

LTC vs ETH : Bottom ? Hello:
Good ? me no or yes.
ETH vs LTC.
Eth is good but LTC ? LTC is a giant which sleep.
The chart show us a possible H&S pattern inverted.
My view is something like it.
If you want be safe, enter when red line is break.
GL

Litecoin - Expecting Bullish Continuation In The Short TermH4 - We have a clean bullish trend with the price creating a series of higher highs, higher lows structure.
This strong bullish momentum is followed by a pullback.
No opposite signs.
Until the two Fibonacci support zones hold I expect the price to move higher further.
If you enjoy this idea, don’t forget to LIKE 👍, FOLLOW ✅, SHARE 🙌, and COMMENT ✍! Drop your thoughts and charts below to keep the discussion going. Your support helps keep this content free and reach more people! 🚀
--------------------------------------------------------------------------------------------------------------------

Litecoin Rebounds Off Trendline in Bullish Continuation SetupFenzoFx—Litecoin rebounded from the ascending trendline, a demand zone supported by the VWAP from July 25th.
Immediate resistance stands at $114.3. A close above this level may resume the bullish trend, potentially targeting previous highs near $114.3.

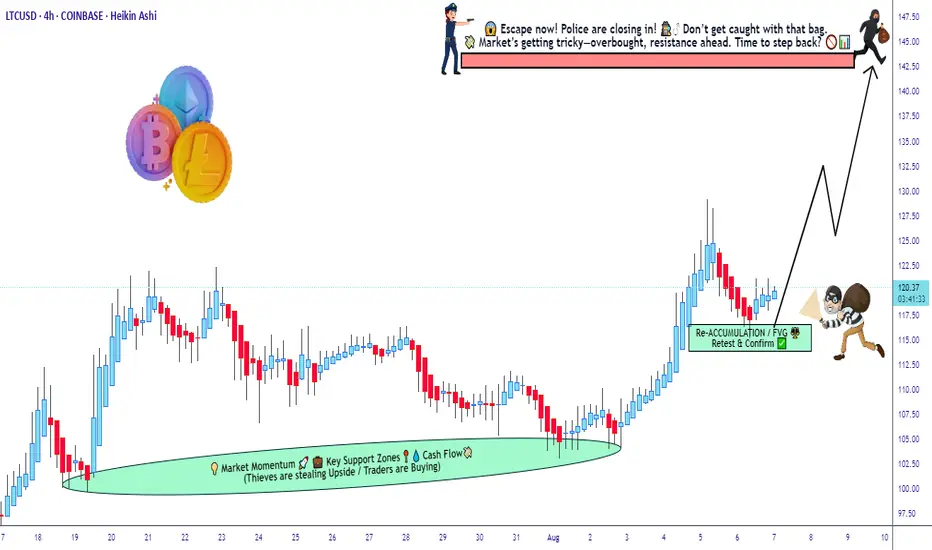
"Is LTC/USD the next target of a stealth bull raid?”🎯 LTC/USD HEIST ALERT: BULLISH LAYER HEIST PLAN! 💎🚁
PLUNDER PLAN: BULLISH
Thief entering the LTC/USD market with calculated stealth—multi-layered buy-limit entries, master-level layering strategy 🌪️💰
👾 ENTRY STRATEGY:
Stack multiple limit orders at staggered price levels (layering like a patient 🐍 thief)
Enter at any price, staying ready to pounce at key zones, using alerts for breakouts
🛑 STOP LOSS:
Fixed SL at 110.00 USD
Keep tight risk control—stop’s your escape hatch!
🏹 TARGET:
Primary profit target: 143.00 USD
Use trailing stop-loss to lock gains early if momentum fades
🧠 THIEF TRADER TACTICS:
Limit orders only—no chasing
Enter the trend, don’t fight it—avoid shorts during bullish bias
For scalpers: swift layered fills
For swing traders: build position patiently
💎 RISK MANAGEMENT:
Every limit order has a stop-loss
Total risk should be controlled—ideal risk‑reward if full strategy plays out
🔍 MARKET CONTEXT:
Bullish outlook supported by confluence of:
macro themes, sentiment swings, on‑chain flows, and intermarket setups
Layered entries optimize risk while capturing upside
⚠️ Avoid trading during high‑volatility news events
Trailing stops = lock profit & evade chaos
📣 CALL TO ACTION:
💥 If you feel the energy, smash that Like and Follow, comment your plan, and join the crew. Let’s rob the market level by level 🔓🎯
Stay sharp, stay sneaky — see you at the target 🔐
— Thief Trader 🐱👤💵🚀
LTCUSD H4 | Bullish bounceLitecoin (LTC/USD) is falling towards the buy entry which is an overlap support and could bounce to the upside.
Buy entry is at 110.50, an overlap support that is slightly above the 78.6% Fibonacci retracement.
Stop loss is at 101.23, which is a swing low support.
Take profit is at 123.91, which is a swing high resistance.
High Risk Investment Warning
Trading Forex/CFDs on margin carries a high level of risk and may not be suitable for all investors. Leverage can work against you.
Stratos Markets Limited (tradu.com ):
CFDs are complex instruments and come with a high risk of losing money rapidly due to leverage. 65% of retail investor accounts lose money when trading CFDs with this provider. You should consider whether you understand how CFDs work and whether you can afford to take the high risk of losing your money.
Stratos Europe Ltd (tradu.com ):
CFDs are complex instruments and come with a high risk of losing money rapidly due to leverage. 66% of retail investor accounts lose money when trading CFDs with this provider. You should consider whether you understand how CFDs work and whether you can afford to take the high risk of losing your money.
Stratos Global LLC (tradu.com ):
Losses can exceed deposits.
Please be advised that the information presented on TradingView is provided to Tradu (‘Company’, ‘we’) by a third-party provider (‘TFA Global Pte Ltd’). Please be reminded that you are solely responsible for the trading decisions on your account. There is a very high degree of risk involved in trading. Any information and/or content is intended entirely for research, educational and informational purposes only and does not constitute investment or consultation advice or investment strategy. The information is not tailored to the investment needs of any specific person and therefore does not involve a consideration of any of the investment objectives, financial situation or needs of any viewer that may receive it. Kindly also note that past performance is not a reliable indicator of future results. Actual results may differ materially from those anticipated in forward-looking or past performance statements. We assume no liability as to the accuracy or completeness of any of the information and/or content provided herein and the Company cannot be held responsible for any omission, mistake nor for any loss or damage including without limitation to any loss of profit which may arise from reliance on any information supplied by TFA Global Pte Ltd.
The speaker(s) is neither an employee, agent nor representative of Tradu and is therefore acting independently. The opinions given are their own, constitute general market commentary, and do not constitute the opinion or advice of Tradu or any form of personal or investment advice. Tradu neither endorses nor guarantees offerings of third-party speakers, nor is Tradu responsible for the content, veracity or opinions of third-party speakers, presenters or participants.

Litecoin Retests $112.3 Support Amid Bullish MomentumLitecoin remains bullish above the 50-day SMA, supported by an ascending trendline. As of now, LTC trades near $113.0, retesting this area as support. A sustained hold above the trendline could initiate another bullish leg, targeting resistance at $130.3.
However, a close and stabilization below the trendline would invalidate this outlook and suggest increased selling pressure.

Trading balanceTrading balance The price of the asset has rebounded from the balance zone. With the prospect of growth into the resistance zone.
