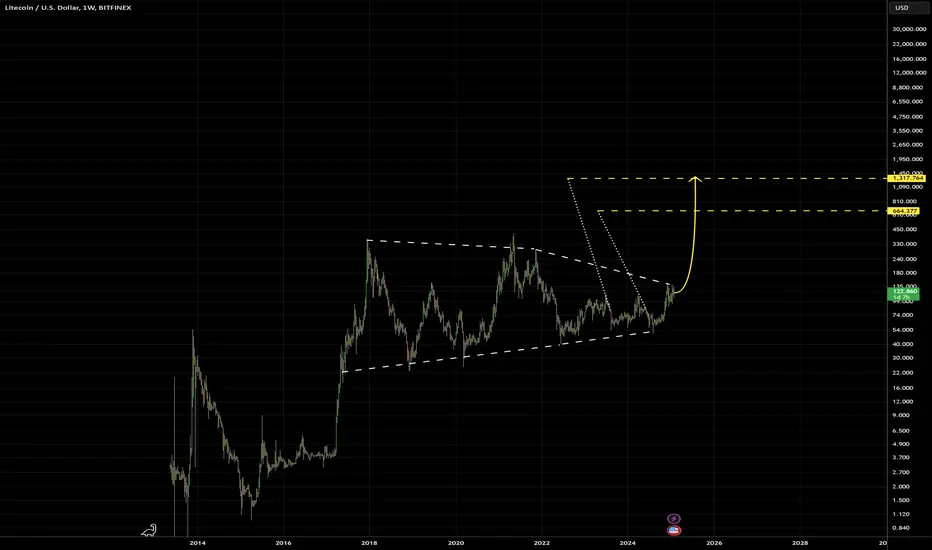
Litecoin: Massive 7-Year Triangle About to Break Out! 600% GainIt's been a long time coming, but the moment has finally arrived. This clear and clean triangle pattern has been developing for the last seven years and now looks complete and ready to break out. Get ready for an exciting ride and some significant gains. I have high confidence in this setup.
We'll see what happens!
Let me know what you think, your comments are greatly appreciated.
Good luck!
LTCUSD trade ideas

Who would have knew, our little LTC could be the oneNice fractal showing up. Lets see if it plays out. At next major low, would be a good one to pick up

LTC giga move opportunity ?The altcoin market has been under constant pressure due to BTC’s increasing dominance. However, despite this, LTC has maintained a strong bullish structure on the weekly chart, which I find quite intriguing. It reminds me of XRP’s past performance. It might be worth the risk to add it to my spot portfolio. Let me know your thoughts!

ltcusdvery Clean traffic ,finally breaking the 109 areas ,now will we touch the h&s neckline? lets see

LTCLitecoin has entered to the golden zone of Fib retracement and volume it is over 37% on 4H TF
which means, if market conditions will be positive, the price could gain traction to 125-142-158$
Waiting for market to regain power and go long.
nfa
dyor

Litecoin may hit ATH in just 4monthsIn this chart we can see clearly Weekly GAP filled but with long wick that means price may return $80 zone area again then we can see clean REAL BULL TREND starts
Currently next few weeks we will see just consolidation around 85-110

LTCUSDlitecoin has been a journey for the past year , right now 109. and above is upside ideas, and 98 and under is downside ideas.. will be waiting

LTCUSD SELL ANALYSIS RISING WEDGE PATTERNHere on Ltcusd price has form a rising wegde and is likely to continue falling so trader should go for short with expect profit target of 93.793459 and 85.718756 . Use money management

ltc long long after dip after massive dip in prices for CRYPTOCAP:BTC makes quick comeback and currently sits at $101k and CRYPTOCAP:ETH at 3800 can we see ltc overcome resistance an head to higher prices

LTC 200%+ trade idea!Not financial advice! Not a professional! Just trying to learn! lol
I will try to get in LTC around $122
Try to get out around $400 a 200%+ trade!

Is an $LTC run imminent?I've been an observer of CRYPTOCAP:LTC on longer time frames for years and it seems to be potentially setting itself up for a massive move similar to March 2017 in aggressiveness.
8 years of cycles and slashing of mining rewards have finally distributed CRYPTOCAP:LTC rewards to the strongest and most determined holders who now are awaiting CRYPTOCAP:LTC ETFs to launch where potentially trillions of dollars of new demand can pour into this infinite resource.
Lets see if its finally Litecoin's time to shine.
Good Luck!
LTCUSD SELL ANALYSIS SMART MONEY CONCEPT Here on Ltcusd price form a supply around level of 128.458012 and is likely to continue moving in down so trader should go for short with expect profit target of 99.590548 and 64.003124 .Use money management

LTC - Will this coin the Next ETF to be approved?
LTC as many Knows is a fork of BTC which has resisted during bad and good times.
Not shitty things, just a fork of BTC with good simple and fast implementations.
Technically speaking this coin has formed a stage 1 base which is actually broken and it is now staying above the 100$ key level.
The historical volatility says that we are at 1/4 of a big movement which can lead this coin to 400$ which is our First target for the medium term.
No one is paying attention because most of the retail are looking to the MEME Chaos. ;-)
But we are surfing it and if we will have more technical confirmation we will add to our buy positions. For now we are in a contraction/ re accumulation zone as the chart shows.
Let's not the market fools you!
What do you thing?
Good trading!!!
LTC/USD "Litecoin vs US Dollar" Crypto Market Bullish Heist Plan🌟Hi! Hola! Ola! Bonjour! Hallo!🌟
Dear Money Makers & Robbers, 🤑 💰
Based on 🔥Thief Trading style technical and fundamental analysis🔥, here is our master plan to heist the LTC/USD "Litecoin vs US Dollar" Crypto market. Please adhere to the strategy I've outlined in the chart, which emphasizes long entry. Our aim is the high-risk Red Zone. Risky level, overbought market, consolidation, trend reversal, trap at the level where traders and bearish robbers are stronger. 🏆💸Be wealthy and safe trade.💪🏆🎉
Entry 📈 : "The vault is wide open! Swipe the Bullish loot at any price - the heist is on!
however I advise placing Buy limit orders within a 15 or 30 minute timeframe. Entry from the most recent or closest low or high level should be in retest.
Stop Loss 🛑: Using the 4H period, the recent / nearest low or high level.
Goal 🎯: 160.00 (or) Escape Before the Target
Scalpers, take note 👀 : only scalp on the Long side. If you have a lot of money, you can go straight away; if not, you can join swing traders and carry out the robbery plan. Use trailing SL to safeguard your money 💰.
📰🗞️Fundamental, Macro, COT, Sentimental Outlook:
🔴Fundamental Analysis
- Increasing Adoption: Litecoin's growing adoption and use cases, such as its integration with payment processors, are driving up demand and prices.
- Improving Scalability: Litecoin's transition to proof-of-stake (PoS) and the implementation of sharding are expected to improve scalability, reducing transaction costs and increasing efficiency.
⚪Macroeconomic Analysis
- Global Economic Trends: The current global economic uncertainty and inflation concerns are driving investors towards cryptocurrencies like Litecoin, which are seen as a hedge against traditional assets.
- Monetary Policy: Central banks' monetary policies, such as interest rate decisions, can impact Litecoin's price.
🟠COT Report
- The COT report suggests that speculative traders are bullish on LTC/USD, while commercial traders are bearish. This could indicate a potential buying opportunity for traders who follow the contrarian approach.
COT Data Breakdown
Long Positions: 52.3% (speculative), 21.1% (commercial)
Short Positions: 47.7% (commercial), 28.9% (speculative)
⚫Sentimental Analysis
- Market Sentiment: Market sentiment is mixed, with some investors expecting a bullish movement due to increasing adoption and improving scalability, while others are bearish due to regulatory uncertainty and market volatility.
🟡Institutional Trader Analysis
- Institutional Positions: Institutional traders are increasingly investing in Litecoin, driven by its growing adoption and use cases.
🟤Retail Trader Analysis
- Retail Positions: Retail traders are also cautious, with some taking long positions on LTC/USD due to increasing adoption and improving scalability, while others are taking short positions due to regulatory uncertainty and market volatility.
🟢Outlook
- Based on the analysis, the LTC/USD pair is expected to move into a bullish direction in the short term, with a target level of 160.00. However, the movement is likely to be volatile, and investors should be cautious ahead of regulatory developments and economic data releases.
⚠️Trading Alert : News Releases and Position Management 📰 🗞️ 🚫🚏
As a reminder, news releases can have a significant impact on market prices and volatility. To minimize potential losses and protect your running positions,
we recommend the following:
Avoid taking new trades during news releases
Use trailing stop-loss orders to protect your running positions and lock in profits
📌Please note that this is a general analysis and not personalized investment advice. It's essential to consider your own risk tolerance and market analysis before making any investment decisions.
📌Keep in mind that these factors can change rapidly, and it's essential to stay up-to-date with market developments and adjust your analysis accordingly.
💖Supporting our robbery plan will enable us to effortlessly make and steal money 💰💵 Tell your friends, Colleagues and family to follow, like, and share. Boost the strength of our robbery team. Every day in this market make money with ease by using the Thief Trading Style.🏆💪🤝❤️🎉🚀
I'll see you soon with another heist plan, so stay tuned 🫂

$LTC IDEAThis is a chart of Litecoin(LTTC), using a 1-day timeframe. The chart includes Gann fan levels, trendlines, and technical indicators such as RSI and MACD. Two specific points on the chart are highlighted with red circles,indicating key support levels or historical reactions. The recent price movement shows a significant rise followed by a correction, approaching a critical support zone. The overall trend and Gann fan analysis suggest key areas of interest for traders monitoring LTC’s price action.

Long Idea on LTCUSDBased on seasonality ,quantitative analysis, 50 ema rejection with pinbar and undervalued condition, im looking to enter long on this trade

LITECOIN - Sell Idea (Short-term)Litecoin is on the backfoot again. Failing to breakout above the key-level resistance of $131.50 suggests that price action has more of that downside potential in the pipeline. Our analysis predicts a continuation of this negative momentum towards the next significant key-level support at $115.00, our official profit target.

LTC ETF ?I think profits from XRP and BTC are rotating into LTC, if so the volume will keep increasing as days go by
We can see that it is breaking out from a long range, plus the market cap is so low that it is easy for large operators to pump, also most shitcoiners are holding things like WIF instead of good ol quality shitcoins.

Litecoin price action "I've analyzed Litecoin's price behavior for the next three months. In my view, the intersection points of the trend lines on April 2nd and May 9th suggest a likely price correction toward these lines." #LTC

LTC Litecoin 24hr potterboxLTC Litecoin 24hr potterbox . This gives us a look at how you can trade inside the box and make some money. Its above the 200 day moving average. this might be the time it shoots right thru the top of the box. hhopefully. Happy Trading

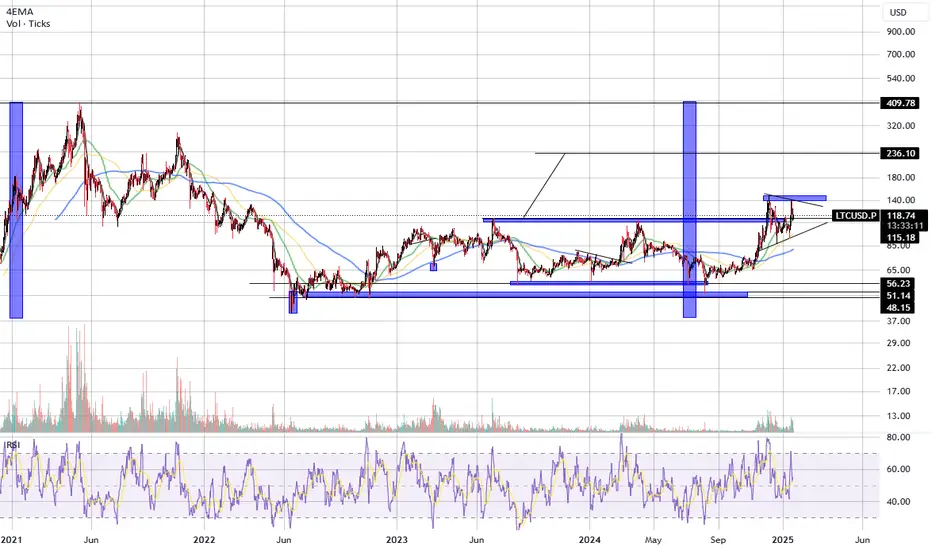
LTCUSD looking for a break-out to $255.Last time we looked at Litecoin (LTCUSD) was 3.5 months ago (October 10 2024, see chart below) when we gave the most timely buy signal, right before it started the strongest rally of its Bull Cycle yet:
Since however the break-out wasn't as aggressive as we initially expected, we have to downgrade our Target. The sequence in terms of 1W RSI is so far similar to the previous Cycles, it's just that the price hasn't responded as aggressively as then.
As you can see, LTC made the expected 1W RSI peak (December 02 2024) and then as the price started to consolidate, it declined, entering a Channel Down. This is no different that the previous RSI Cycle peaks (Dec 28 2020 and May 01 2017).
The difference is that in 2017 the price responded with a huger continuation rally just shy off the 4.0 Fibonacci extension from the consolidation stage, while in 2020 it 'only' managed to reach the 2.5 Fib.
The current pattern appears to have more in common with 2020/21, so we are downgrading our Target to match the current 2.5 Fib at $255.00. It is not impossible to reach $400 by the end of this Cycle (year) but it is best to pursue it only if you can accept elevated risk.
-------------------------------------------------------------------------------
** Please LIKE 👍, FOLLOW ✅, SHARE 🙌 and COMMENT ✍ if you enjoy this idea! Also share your ideas and charts in the comments section below! This is best way to keep it relevant, support us, keep the content here free and allow the idea to reach as many people as possible. **
-------------------------------------------------------------------------------
💸💸💸💸💸💸
👇 👇 👇 👇 👇 👇

LTC 250$?#LTC is currently at a key level on the weekly timeframe.
If buyers can hold Litecoin above $100, it could start moving upward.
This is just my personal view, not financial advice.

LITECOIN - Sell Idea (Short-term)The failure the crack the key-level resistance of $128.10, followed by the breakdown below the key-level support at $122.70 is a strong indication that price action will continue on this downside path, at least for the short-term period of time. The next significant key-level support at $116.75 represents our short-term profit target for this new bearish campaign.
