LTC long time look outI made this graph a 6 months ago. I dont have any trade skills, few years of hodling, only :)
LTCUSD trade ideas

LTCUSD Will Go Higher! Buy!
Take a look at our analysis for LTCUSD.
Time Frame: 12h
Current Trend: Bullish
Sentiment: Oversold (based on 7-period RSI)
Forecast: Bullish
The market is trading around a solid horizontal structure 84.13.
The above observations make me that the market will inevitably achieve 90.56 level.
P.S
The term oversold refers to a condition where an asset has traded lower in price and has the potential for a price bounce.
Overbought refers to market scenarios where the instrument is traded considerably higher than its fair value. Overvaluation is caused by market sentiments when there is positive news.
Like and subscribe and comment my ideas if you enjoy them!

Litecoin to break higher?Litecoin - 24h expiry - We look to Buy a break of 83.52 (stop at 80.52)
We are trading at oversold extremes.
Bullish divergence is expected to support prices.
Dips continue to attract buyers.
Prices have reacted from 79.15.
The bias is to break to the upside.
Our profit targets will be 90.52 and 92.52
Resistance: 83.40 / 85.50 / 87.50
Support: 82.00 / 79.15 / 77.50
Please be advised that the information presented on TradingView is provided to Vantage (‘Vantage Global Limited’, ‘we’) by a third-party provider (‘Everest Fortune Group’). Please be reminded that you are solely responsible for the trading decisions on your account. There is a very high degree of risk involved in trading. Any information and/or content is intended entirely for research, educational and informational purposes only and does not constitute investment or consultation advice or investment strategy. The information is not tailored to the investment needs of any specific person and therefore does not involve a consideration of any of the investment objectives, financial situation or needs of any viewer that may receive it. Kindly also note that past performance is not a reliable indicator of future results. Actual results may differ materially from those anticipated in forward-looking or past performance statements. We assume no liability as to the accuracy or completeness of any of the information and/or content provided herein and the Company cannot be held responsible for any omission, mistake nor for any loss or damage including without limitation to any loss of profit which may arise from reliance on any information supplied by Everest Fortune Group

LTC! TARGET #1 SMASHEDAND just like that...
LTC did in fact, RESPECT THE TA. Lots of money makers coming soon

45m: $LTC - Beautiful; Trendline BustedHey y'all. Lets just appreciate how beautiful LTC looks this fine Saturday.... ;)
Jokes aside, LTC can busted through the local trendline on the 45min time-frame and is now breaking above the local demand line and is getting some nice follow through from the bullish divergence i.e the RSI.
LTC is looking pretty good compared to some of the other coins and its price movement/structure is a lot more appealing when trying to size up the asset and make a better judgment on where she might go.
However, we must get confirmation via a backtest of the local demand line in order to feel a lot more confident IF one was going to put in a position.
These are just my opinions and me just charting pretty things on a saturday night.... ;)
Later traders
/r
-B

Ltc ready to pop I'm seeing a lot to like about the coin and I'm buying the coin on Monday 7th aug for a semi long term 2 to 3 weeks . Should pay dividends over 2 weeks .

The trend is your friend till the end! Last hope for LTC!We're in an ascending channel on the daily. I believe the daily price action will touch the bottom of this channel sometime soon, this will also coincide with the daily RSI touching oversold. This looks like an excellent entry point, but as always keep a stop loss because we are after the halving and this whole bullish structure is breaking.
Not financial advice.

LTC/USD OUTLOOK FOR THE NEXT BULL RUN 👀🇬🇧 For the moment the halving is manifesting itself as a "Buy the rumor, Sell the news"
In my view I believe we will see a -40% decline over the next 6 months and complete the symmetrical triangle. Waiting for interesting buying areas, ideally 55/65
Long-term target (2024) 330, any price spikes would also bring it to around 500. It is always an altcoin of dubious utility to be taken with a grain of salt.
🇮🇹 Per il momento l'halving si sta manifestando come un"Buy the rumor, Sell the news"
A mio avviso credo che assisteremo a un calo del -40% nei prossimi 6 mesi e completeremo il triangolo simmetrico. Aspettando aree interessanti di acquisto, idealmente 55/65
Target di lungo periodo (2024) 330, eventuali spike di prezzo lo porterebbero anche intorno ai 500. Rimane sempre un altcoin dalla dubbia utilità' da prendere con le pinze.

Selling Litecoin at previous support.Litecoin - 24h expiry - We look to Sell at 87.88 (stop at 90.88)
Previous support level of 88 broken.
Previous support at 88 now becomes resistance.
We look for a temporary move higher.
Preferred trade is to sell into rallies.
Daily signals are bearish.
Our profit targets will be 80.88 and 78.88
Resistance: 83.00 / 85.50 / 88.00
Support: 82.20 / 80.80 / 78.00
Please be advised that the information presented on TradingView is provided to Vantage (‘Vantage Global Limited’, ‘we’) by a third-party provider (‘Everest Fortune Group’). Please be reminded that you are solely responsible for the trading decisions on your account. There is a very high degree of risk involved in trading. Any information and/or content is intended entirely for research, educational and informational purposes only and does not constitute investment or consultation advice or investment strategy. The information is not tailored to the investment needs of any specific person and therefore does not involve a consideration of any of the investment objectives, financial situation or needs of any viewer that may receive it. Kindly also note that past performance is not a reliable indicator of future results. Actual results may differ materially from those anticipated in forward-looking or past performance statements. We assume no liability as to the accuracy or completeness of any of the information and/or content provided herein and the Company cannot be held responsible for any omission, mistake nor for any loss or damage including without limitation to any loss of profit which may arise from reliance on any information supplied by Everest Fortune Group.

LTCUSDTHello Traders,
AS we can see That LTC is currently on the strong double bottom bottom and also in a channel as per the chart prediction we can open a long from here.
follow chart plan to open a position.

LTCUSDTHello Traders,
AS we can see That LTC is currently on the strong double bottom bottom and also in a channel as per the chart prediction we can open a long from here.
follow chart plan to open a position.

Is there THIS hope for LTC?I'm fairly convinced that LTC's future is closely tied to that of BTC.
Going by historical data, LTC has posted new all time highs after BTC has done so (in the so called Alt Season).
So the real question is what will BTC do?
Here, I've drawn a channel, support by the ichi cloud.
The halving has passed, and it seems LTC is holding up okay (so far).
We are also close to a major pivot area (based on prior trade data, you can see this zone acted as support and resistance) ... so either this is where it holds, and eventually we go up, or there could be a fairly substantial downward correction happening ... but I wouldn't play that unless it breaks this channel, the cloud, and the pivot area and clearly closes below it.
Not financial or trading advice. Just the little thoughts in my head.
Your trades are your risks.

Halving LTC 2023LTC/USDT
The LiteCoin halving of 2019 will be reduced by 1 to $24,353 (-75.38%). Even this halving will be the same as it concerns the reduction where we will not have golden opportunities to invest in cheaper inputs. Below I have given 4 entries to be positioned in this signal.
LONG TERM
Entry 1 : 60$ (30%)
Entry 2 : 30$ (30%)
Entry 3 : 15$ (25%)
Entry 4 : 5$ (15%)
TP 1 : 310$
TP 2 : 450$
TP 3 : 600$

Litecoin Halving done❗️ And now❓Litecoin Halving done❗️
Next LTC bullish breakout not earlier than end of 2024❓
What are your thoughts on this scenario dear Crypto Nation?
Let me know your thoughts in the comments🤗
⬇️⬇️⬇️
Likes and Follow for updates appreciated🤗
Disclaimer:
Not financial advice
Do your own research before investing
The content shared is for educational purposes only and is my personal opinion

LTC Retesting BreakoutLTC is testing its 30th June breakout. LTC broke out of a wedge, pierced the 200 weekly moving average, but could not hold above it, and is now retesting the breakout of that wedge.
It must hold above this, otherwise we can assume the pre-halving rally is over.

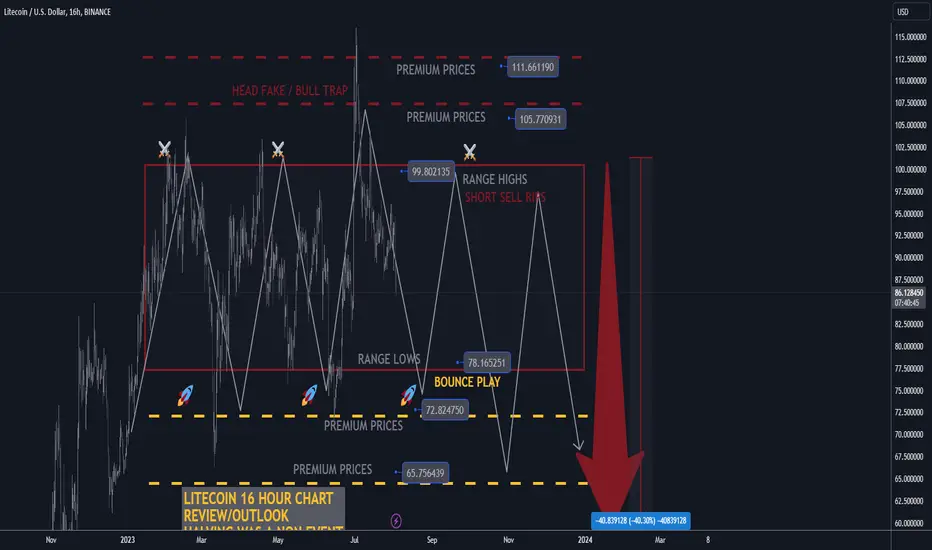
ltcusd h16 halving was a non-event now we dump🔸Hello traders, let's review the 16hour price chart for LTC today. Halving was a non-event
and degen dreamers and gamblers got rekkt once again, sorry about that.
🔸Past history of LTC halvings show that we dump into red after the halving. there is no
bullish impact on prices of litecoin. currently distribution in range trading near 85 USD.
my final PT bears is 60 USD.
🔸Recommended strategy LTCUSD bears: wait for a bounce later to initiate from 80 USD
and rejection after the bounce near 95-100 USD and re-short from resistance. Conservative
TP bears is 60 USD. good luck traders!
🎁Please hit the like button and
🎁Leave a comment to support our team!
RISK DISCLAIMER:
Trading Futures , Forex, CFDs and Stocks involves a risk of loss.
Please consider carefully if such trading is appropriate for you.
Past performance is not indicative of future results.
Always limit your leverage and use tight stop loss.
Is Litecoin resurging as the silver of cryptos after the halvingHere's an idea for the long-term configuration of this asset.
Cup and handle pattern on the weekly chart.
Halving occurred on the day of the post.
Could this be the resurgence of the silver cryptocurrency?

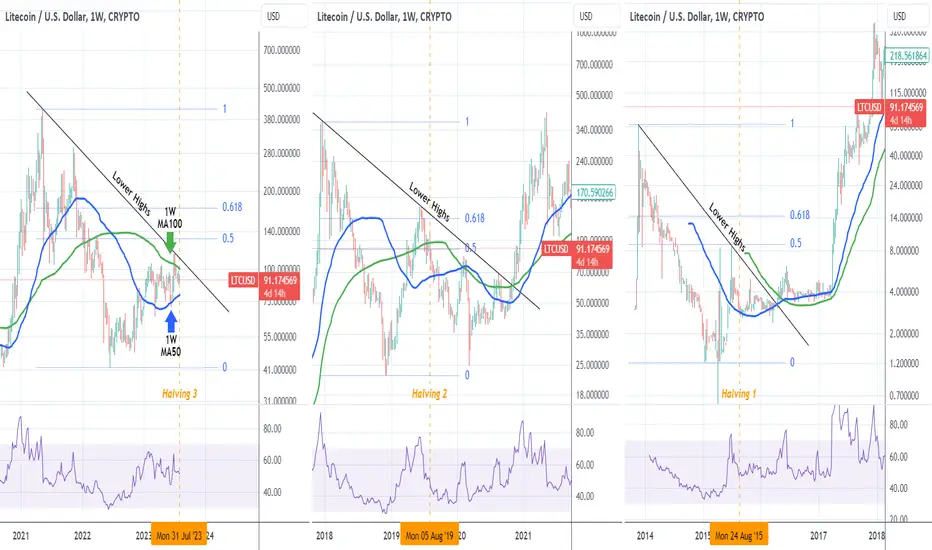
LITECOIN Halving only a few hours away! Is it bullish or not?Litecoin (LTCUSD) is having its 3rd Halving event in less than 5 hours from the time this analysis was constructed. The question on everyone's mind is how will this affect the price action? Will it be bullish or bearish? A reliable way to answer this is by looking into the past events and how those affected LTC.
The previous two Halvings were on August 05 2019 (Halving 2) and August 25 2015 (Halving 1) respectively. All halving events have caught the price on a pull-back after a break above the 1W MA100 (green trend-line) with the 1W MA50 (blue trend-line) supporting. During the previous two, the price managed to reach the 0.5 Fibonacci retracement level, while on the current Cycle it came $25 shy of it.
It appears that the current Bull Cycle has started on a slower pace than the previous two, as also illustrated on the 1W RSI, which hasn't yet crossed the 70.00 overbought barrier. They key is the Lower Highs trend-line, which on all Halvings made contact with the pre-Halving Lower High and once broken the price never made a Lower Low again. If you want to take the safest buy entry possible, wait for that break-out to happen.
-------------------------------------------------------------------------------
** Please LIKE 👍, FOLLOW ✅, SHARE 🙌 and COMMENT ✍ if you enjoy this idea! Also share your ideas and charts in the comments section below! **
-------------------------------------------------------------------------------
💸💸💸💸💸💸
👇 👇 👇 👇 👇 👇
Crypto Market in 24 Hours: Bright Outlook ⛅, LTC Halving LoomSunny trading conditions with a few scattered clouds ⛅ prevail on the global crypto market in the next hours and days, signaling a slightly bullish market with upside potential. Cryptos rebound following Tuesday’s sell-off.
Bitcoin rises 2.3%, and Ethereum puts on 1.1% in the past 24 hours. The price of Bitcoin fell below the psychological $29,000 threshold due to the SEC lawsuit against a crypto entrepreneur and the dollar's strength ahead of US macro data release. Litecoin halving looms later today, diminishing the coin's mining reward. 🚀💰
Follow us for more crypto weather reports!
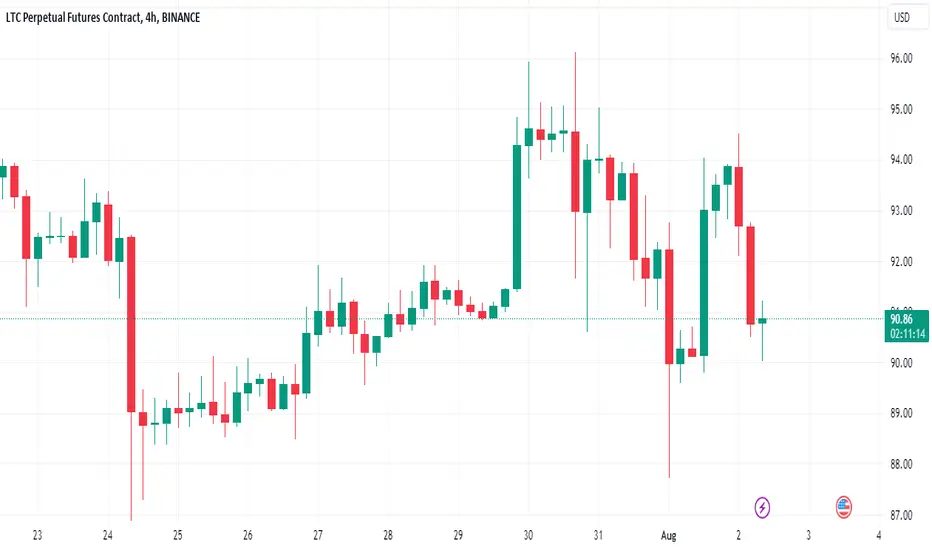
Trapped in a range, Will LTC resurface above $100?The LTC price is currently in a consolidation phase on the 4-hour chart, with a trading range between $88 and $95.
The price has experienced a 3.97% fall, indicated by three consecutive bearish candles.
Despite the bearish phase, there are signs of a potential early reversal, supported by the declining trend in the 4-hour timeframe.
The RSI line shows a bullish divergence, indicating a possibility of upward momentum.
If the buyers fail to maintain dominance at $88, the LTC price may test the $82 level and then potentially retest the $72 support.
On the positive side, a bullish reversal breaking above $95 can lead to a breakout rally, pushing the LTC price to $104.
Sustaining the breakout rally above $100 could lead the buyers to drive the uptrend further, challenging the previous swing high at $113.

Update LTC before halving LTC is still trading in the 89-95 range. Level to watch for breakout are 91-94. Only clear breaks of these levels will show the direction for the next big move. Not much to do here. NFA

✴️ Litecoin Halving 2023, What About The Chart?What is the chart saying as Litecoin approaches its halving event?
Yesterday was a good day for Litecoin because a candle wicked below EMA10/21/50/100 but managed to close above it.
Sellers jumped in but were fully negated.
Buyers showed up in drove.
The day (1-Aug.) ended green and with above average volume, which are great bullish signals.
Looking at these signals together with the MACD can be useful:
The MACD is showing a young bullish cross and the histogram has gone green.
Noting by looking back that each time the histogram goes green it stays green for a while. Never it goes green for a day and then red... Meaning that prices are ready to grow or at the least the MACD is set to move higher which precedes a price jump.
To be fair these signals are not that strong.
These signals are good but mild... It is better mild bullish signals than weak or strong bearish signals.
The fact that the signals are bullish is what counts and the fact that Bitcoin is gaining bullish momentum as it moves up.
What one does, the rest follows.
Cryptocurrency is set to grow in August 2023. Easy.
Very strong negative news, yet nothing falls.
When negative news fail to affect the market, it becomes the inverse, a strong bullish signal... That's another point for the upside.
If you wait patiently, you will see exactly what I am saying drawn on the charts.
How will you use this information?
To make money of course.
Namaste.

LTCUSD - Sideways MarketThe pair LTCUSD is currently in a sideways market. The potential supports and resistances have been defined. It has the tendency to go bearish or bullish. For both cases, the entry points, stop losses, and profit levels are defined. Let's see the market goes which side now!
