LTC Swing Short to $75 for Aug. 2 Halving This LTC trade was posted several weeks ago with short trade setup centered around the August 2 LTC halving.
There is a repetitive cycle in which LTC consistently drops leading into its halving event.
LTC peaked at $114 for the best short entry, which was caused by a false narrative that LTC would pump to $130
There was a second chance opportunity to short LTC at $100.
The orange trendline is acting as a key resistance level, but LTC is showing bullishness and has broken this resistance line for now.
The white trendline is acting as support, but this support level has broken already and is weak support.
Target Price
TP 1
I’m looking for some bearishness in August with a drop down to the yellow trendline with an estimated price of $75.
LTCUSD trade ideas

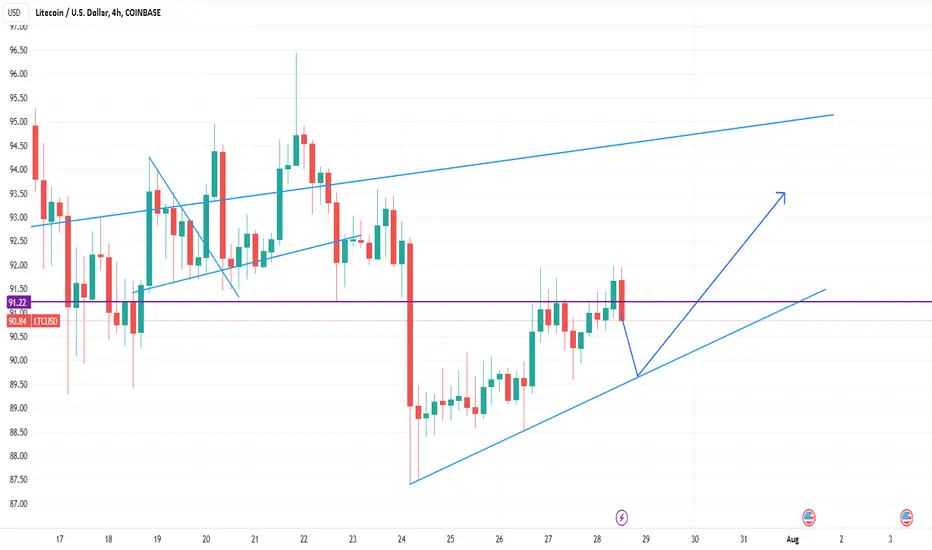
Buying Litecoin at trend line support.Litecoin - 24h expiry - We look to Buy at 91.51 (stop at 89.11)
Trend line support is located at 91.40.
Bespoke support is located at 91.50.
We look to buy dips.
Intraday signals are mildly bullish.
Expect trading to remain mixed and volatile.
Our profit targets will be 97.51 and 98.51
Resistance: 93.50 / 95.00 / 96.27
Support: 93.00 / 92.00 / 91.00
Please be advised that the information presented on TradingView is provided to Vantage (‘Vantage Global Limited’, ‘we’) by a third-party provider (‘Everest Fortune Group’). Please be reminded that you are solely responsible for the trading decisions on your account. There is a very high degree of risk involved in trading. Any information and/or content is intended entirely for research, educational and informational purposes only and does not constitute investment or consultation advice or investment strategy. The information is not tailored to the investment needs of any specific person and therefore does not involve a consideration of any of the investment objectives, financial situation or needs of any viewer that may receive it. Kindly also note that past performance is not a reliable indicator of future results. Actual results may differ materially from those anticipated in forward-looking or past performance statements. We assume no liability as to the accuracy or completeness of any of the information and/or content provided herein and the Company cannot be held responsible for any omission, mistake nor for any loss or damage including without limitation to any loss of profit which may arise from reliance on any information supplied by Everest Fortune Group.

LTC, would you make up your mind? PLEASE?In 2 days we have a halving. Although prior LTC halvings have not produced all time highs ... they have spurred a local rally. This one seems to have fizzled out prematurely. But you have to ask, what was with all that volume several weeks ago that resulting in a 40% inter-day increase??? That is a lot of money, and what was the strategy there?
I've identified a possible channel for the bullish scenario, and how a break to the bottom leads to a correction for LTC following the halving ... let's see. I hope there is still life in LTC.
Not trading or investment advice. Trade at your own risk.

LTC going to surge if...! Hi traders let have quick analysis on LTC .
LTC halving is going to happen soon which is very bullish , but we should watching BTC because its leading the whole market up and down.
LTC prepare for a big move up and i am waiting for MACD on 1D time frame to cross then going Long
keep it simple

litecoin going back into trianglelitecoin is doing a false breakout, it is going to go back in and the blue trendline will most likely act as support.
Falling Wedge on Litecoin Occuring right before halvingLooking for a breakout to the upside with a price target of $150 if a bull break run occurs at the end of this falling wedge pattern on the daily.

#ltc longlong ltc as it is on the resistance and going to follow the trend line and consolidate within the range.

Litecoin Targeting Weekly ResistanceTend Bullish
Litecoin price has a weak spot that could implode with LTC diving 15%
The network has gained more than 300,000 new addresses in the first week of May.
The next Litecoin halving is scheduled for August 12 tentatively, and such events have been synonymous with price rises.
Litecoin price, despite having a major event coming up in about three months, is still mostly following the broader market cues. However, the altcoin’s investors have been growing bullish by the day, and the same is visible in their participation, which is currently far higher than the average.
In the first week of May, the Litecoin network noted the addition of nearly 300,000 new addresses that hold some amount of LTC. This is a nearly 300% jump from the average weekly rate, as throughout the last month, the network only added a total of 300,000 addresses, bringing the weekly average to 75,000.
The total addresses holding a balance now stand at 7.56 million, and the possibility of the same rising further is high. This is because the “silver to Bitcoin’s gold” is set to go through its third halving event, wherein the reward for validating a block will be slashed by 50% from 12.5 LTC to 6.25 LTC.
These events have been synonymous with price rises, as observed in the past in August 2015 and August 2019. Thus by the looks of it, crypto investors are preparing to bank on this potential and make profits by joining the network.
This could prove to be bullish for the price action as well, as investors could likely accumulate further, given Litecoin price is low right now. As it is, the Relative Strength Index (RSI) is nearing the oversold zone, below 30.0. A move into the zone followed by an exit would confirm a reversal in trend, triggering a recovery rally.
If this situation plays out over the next couple of days, Litecoin price might be in for a rally.


LTCUSDIn this range, the time is not suitable for long-term purchase
There are better positions at the bottom of the weekly chart
We have tracked them so we have plans for the long term which will be provided in due course
But at this time, nothing else can be seen for this currency except for the proper sale. Buying is high risk, but selling is more beautiful after collecting cash.
Manage risk
Smart Money
Hunter
Liquidity
Cryptocurrency

LTC I set this Triangle Pennant focus of this current build up. I set a curve channel for the inner range movement within the triangle. I set some focus ranges of dates of entries and exits potential ranges if it reaches the set up.
THis is just a theory and not financial advice.

ltc/usd 4hI have been observing the top 20 cryptocurrencies for quite a long time, but I have never seen something so beautiful on the chart.

LTC Halving in under 2 weeks! An overview of previous occurences
The next halving of Litecoin is set to occur on August 2, 2023, where the block reward for mining LTC will be reduced by 50% from 12.5 LTC to 6.25 LTC.
This means that LTC miners will receive half the number of LTC for their mining efforts, effectively controlling the inflation rate of LTC and manage its supply over time. Like #Bitcoin, #Litecoin operates on a deflationary monetary policy.
Most traders view this as a bullish event, but as the chart shows, the halving event is a known event , and has likely already been priced into LTC's current price.
During past halving events, we can see that price started rallying a couple months in advance of the halving. For example, the first LTC halving occurred on August 25, 2015 , however the price actually peaked and had a blow-off top in June 2015. From the previous cycle low, it rallied close to 274% before declining 42% post-halving.
The next halving occurred on August 5, 2019. Once again we see that price actually peaked a couple months prior, in June of 2019. From the cycle low of that year, LTC rallied 440% to a high of $150 before again experiencing a blow-off top and declining 75% back to $35-40.
Although there is not a lot of historical data to go on, we are experiencing a similar situation now,. From low earlier this year of $50 , price rallied 125% to a peak of around $115 a couple of weeks. Last week LTC declined by -16%, and with two weeks to go before the next halving I do believe we have seen the top for now. Going by prior iterations, we could see even further price depreciation, perhaps back to the range lows of $75.

LTC presents a bearish H1 structureLTC presents a bearish H1 structure and a bullish H4 structure. Currently on the lookout for a sell setup.

LTC Halving Potential Long Next WeekAs the lite coin halving is approaching there is some potential bullish price action building on the chart.
This is a 4 hour line chart with a clear wedge falling right into a local golden pocket at a known past support level.
It is impossible to predict a brake out date or price targets but high probability time frame would be by the tip of this wedge on August 1st and for price a 1.5-1.618 expansion of this range would be a 55% price rise corresponding to past resistance.
Trade Well.

LTC - Contemplating movement to 140if the wyckoff phases are applied then LTC appears to be in phase C and the next move up should be to test the AR (Automatic Reaction ) area at around the 140 to 150 zone

✴️ Litecoin Renko Confirms Bottom, Long-Term Higher LowsThis is the last one of the Renko series, Litecoin.
1) July 2017 confirms bottom, ultra high volume followed by massive of growth.
2) November 2020 ultra high volume confirms bottom, followed by more than a year of growth.
3) January 2023, ultra-high volume, new brick 6 months later as confirmation confirms bottom. We can expect a new 5 up wave pattern (years of growth).
Since 2017 we have higher highs and higher lows.
It will be great.
I am happy to be part of this upcoming event, we will remember this bull-market all of our lives, we will build new relationships, it will create tons of wealth, not only the market but also us, as humans, as friends, as individuals; we will grow.
Thank you for reading.
I mean, truly thank you... We've been sharing/exchanging for many years now and some how I continue to receive your support.
Thank you.
Namaste.

Byeeee Litecoin (LTC)Andddddddd...... its time for Litecoin to lose a lot of value.... We have not been able to break above W1, which is also where our resistance lines are also. We attempted to push at it but have since lost almost 20%. I am confident that we should see more downside as in the bigger picture we have started W5 to the downside.

Litecoin has turned negative.Litecoin - 24h expiry - We look to Sell at 97.78 (stop at 101.38)
Bespoke resistance is located at 98.
97.85 has been pivotal.
Short term bias has turned negative.
The trend of higher intraday lows has also been broken.
Preferred trade is to sell into rallies.
Our profit targets will be 88.78 and 86.78
Resistance: 93.00 / 95.00 / 98.00
Support: 89.12 / 88.00 / 86.00
Please be advised that the information presented on TradingView is provided to Vantage (‘Vantage Global Limited’, ‘we’) by a third-party provider (‘Everest Fortune Group’). Please be reminded that you are solely responsible for the trading decisions on your account. There is a very high degree of risk involved in trading. Any information and/or content is intended entirely for research, educational and informational purposes only and does not constitute investment or consultation advice or investment strategy. The information is not tailored to the investment needs of any specific person and therefore does not involve a consideration of any of the investment objectives, financial situation or needs of any viewer that may receive it. Kindly also note that past performance is not a reliable indicator of future results. Actual results may differ materially from those anticipated in forward-looking or past performance statements. We assume no liability as to the accuracy or completeness of any of the information and/or content provided herein and the Company cannot be held responsible for any omission, mistake nor for any loss or damage including without limitation to any loss of profit which may arise from reliance on any information supplied by Everest Fortune Group.


LTC halving pump period has begun, based on previous halvingBased on previous halvings LTC should be in a very bullish period for the next 2 months. Of course if SPY and the big boys start to tank this would be voided so need to keep an eye on SPY/SPX

LITECOINIf history repeats itself in LTC, it's about to start pumping soon.
Of course, he can drop a wick into the green to soak up the moonboys before the trip, but the number of fakeots in this flag pattern has reached unbelievable numbers in the last six months, so another one would be ridiculous.
It's not for trading, just my opinion.
Maybe it will be different this time :)

Litecoin/U.S DollarBINANCE:LTCUSDT
Breakout Retesting it wil go high from here to test 120 levels check price action here zooming into lower time frame for early entry to long .
